


"Advanced" Tab
Used to perform advanced settings for the statistical charts in the current statistical thematic map. All settings in this tab are reflected in the current statistical thematic map in real time, i.e., what you see is what you get.
-
"Options" Area: This area is used to adjust and control the display of statistical charts in the statistical thematic map.
- Flow: Check this box to enable flow display for the thematic map's rendering style, meaning the statistical charts will move with map changes to achieve an optimized effect of showing all. When the flow effect is enabled, do not use the partly refresh function, as it may cause incorrect display of the partly refresh effect (SuperMap iDesktopX does not support the partly refresh function).
- No Overlap: Check this box to enable automatic adjustment of statistical charts on the map within a certain range, achieving simultaneous display without overlapping or interfering with each other.
- Show Negative: Check this box to display statistical charts on the map corresponding to objects with negative attribute values.
- Scale Statistics with Map: Check this box to allow statistical symbols to enlarge or shrink with map zooming; otherwise, all statistical symbols will have a fixed display size according to the dialog's parameters and will not change size with map zooming.
- Show Leader Line: Can be set to connect the thematic map to the object it expresses with a leader line when the thematic map is offset from that object. If the "Flow" checkbox is checked, the "Show Leader Line" checkbox becomes selectable. Check this box to enable the "Line Style" button on the right. Click this button to set the style of the leader line in the popped-up "Symbol Library Management" window.
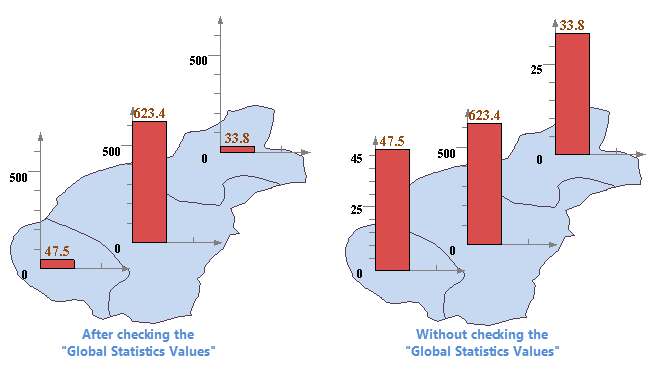
- Global Statistics Values: Check this box, and the current statistical thematic map will determine the display scale of statistical value symbols by judging all statistical values. Each statistical chart is displayed according to the same scale for statistical marker size. As shown in the left figure below, the three statistical values display bar chart heights according to the same coordinate scale. Suitable for expressing the comparative relationship between statistical values, the proportion between statistical values can be seen through the display of statistical symbols.
Uncheck this box, and the program will determine the display scale range based on the attribute values of the current statistical range; there is no proportional relationship between statistical values. As shown in the right figure below, the three statistical value bar charts are not correlated; each independently represents its current statistical value.
 |
- Start Expression: Check the "Start Expression" box to control the display size of statistical symbols through field values, or directly input a numerical value to set the size of statistical symbols, with the unit being map unit. The fields in the drop-down list here default to displaying as field aliases. If needed, you can switch to field names in the File Tab -> Options Group. For details, please refer to the Preference Settings document.
- Maximum Display Value: Sets the display size of the statistical symbol for the object with the maximum statistical value. When the thematic type is Pie Chart, 3D Pie Chart, Rose Chart, 3D Rose Chart, or Ring Chart, the diameter of the statistical chart is one-quarter of the Maximum Display Value. For example, if the Maximum Display Value for a pie chart is set to 10000, the maximum diameter of the pie chart is one-quarter of 10000, i.e., 2500. For other types of statistical thematic maps, such as Bar Chart, Area Chart, etc., the height of the statistical chart is one-quarter of the Maximum Display Value. For example, if the Maximum Display Value for a bar chart is set to 10000, the maximum height of the bar is one-quarter of 10000, i.e., 2500. Other statistical symbols are drawn proportionally based on the maximum and minimum statistical symbols.
- Minimum Display Value: Sets the display size of the statistical symbol for the object with the minimum statistical value. When the thematic type is Pie Chart, 3D Pie Chart, Rose Chart, 3D Rose Chart, or Ring Chart, the diameter of the statistical chart is one-quarter of the Minimum Display Value. For other types of statistical thematic maps, such as Bar Chart, Area Chart, etc., the height of the statistical chart is one-quarter of the Minimum Display Value. Other statistical symbols are drawn proportionally based on the maximum and minimum statistical symbols.
- Offset X: The text box to the right of this label is used to set the X offset of the statistical chart object's anchor point relative to the inner point of the object it expresses. You can click the drop-down button to the right of the text box to select a numeric field as the X offset, or directly enter a numerical value for the X offset in the text box.
- Vertical Offset: The text box to the right of this label is used to set the Y offset of the statistical chart object's anchor point relative to the inner point of the object it expresses. You can click the drop-down button to the right of the text box to select a numeric field as the Y offset, or directly enter a numerical value for the Y offset in the text box.
- Offset Unit: The drop-down button to the right of this label is used to set the unit for the offset value. Click this drop-down button, and in the popped-up drop-down menu, the system provides two offset units for user selection: "Unit" and "0.1mm". "0.1mm" indicates the symbol's offset is in units of 0.1mm; "Unit" means the set offset is consistent with the unit of the map coordinate system.
- Label Format: The system provides five text display formats for statistical thematic maps: Percentage, Real Value, Title, Title + Percentage, Title + Real Value. Users can choose the text format for labels on the current statistical chart as needed.
- Label Style: Sets the style of the label text on the current statistical chart. Users can click the button to the right of this label and set the style of the statistical chart text label in the popped-up Text Style dialog. For details, see: Modify Uniform Label Thematic Map Style.
- Axis Color: Sets the axis color for the current statistical thematic map. Click the button to the right of this label to pop up the color panel, where you can select and set an appropriate axis color.
- Label Mode: The drop-down button to the right of this label is used to display and set the display mode for the current statistical chart axis labels, divided into: Do Not Show, X Axis Only, Y Axis Only, Show All four display modes. The default label mode is Show All.
- Label Style: The Text Style Settings button to the right of this label is used to set the text style for axis labels. Check this box to enable the button on the right. Click it to set the style of the coordinate text in the popped-up Text Style dialog. For details, see: Modify Uniform Label Thematic Map Style.
- Axis Grid: This checkbox can be selected to choose whether to show the axis grid.
- Bar Width Coefficient: Used to set the width of each bar in a bar statistical chart. The default value is half of the current bar chart's maximum width. Users can set the desired bar chart width in the numeric display box to the right of this label. The value can be set between 0 and the maximum width; otherwise, the setting is invalid. The unit is the same as the map. This label only takes effect for Bar Chart, 3D Bar Chart, Stacked Bar Chart, 3D Stacked Bar Chart.
- Bar Spacing Coefficient: Used to set the spacing between bars in a bar chart.
- Start Angle: Sets the start angle for pie/rose statistical charts, defaulting to horizontal positive direction. This label only takes effect for Pie Chart, 3D Pie Chart, Rose Chart, 3D Rose Chart.
- Rose Angle: Sets the slice angle for the rose chart or 3D rose in the statistical chart, defaulting to 0. When the angle is 0 or greater than 360 degrees, 360 degrees is used to equally divide the number of fields used to create the statistical chart.
Notes
- Statistical thematic maps created or modified by users can be saved as templates for application to thematic map creation in other layers. For details on saving as a thematic map template, see: Save to Thematic Map Template Library.
- When creating a thematic map using the "Use Template" method, users can directly select a saved template from the drop-down menu of the "Template" drop-down button to apply it to the creation of other thematic maps.
 Related Topics
 Modify Statistical Thematic Map