


Feature Description
Chart symbology is one of the important functions of SuperMap chart browsing. By setting nautical chart properties parameters, you can control the chart's symbolic style, vertex color, symbols, and boundary type to achieve more accurate and scenario-adaptive chart display effects. This setting helps improve the readability and navigation accuracy of nautical charts.
Operation Steps
- Load the chart group you need to browse into the map.
- Select the Chart tab -> Nautical Chart Properties group -> click the Nautical Chart Properties button. The Nautical Chart Properties panel will pop up on the right. Expand the Show Settings group.
- The Show Settings group contains the following options:
- Display Category: In different application scenarios, selecting an appropriate display method can make the chart data presentation more suitable for your needs.
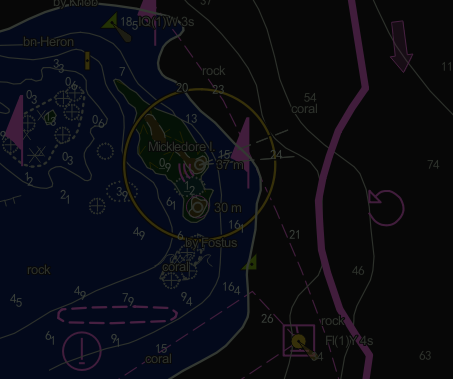
- Chart Symbology: Displays the nautical chart according to the S-52 electronic chart display specification, ensuring symbols comply with industry standards.
- NONE: Displays map data as ordinary points, lines, and areas without symbolic processing. The non-chart symbology mode can effectively improve display performance during chart data editing and reduce interference from chart symbology on editing operations.
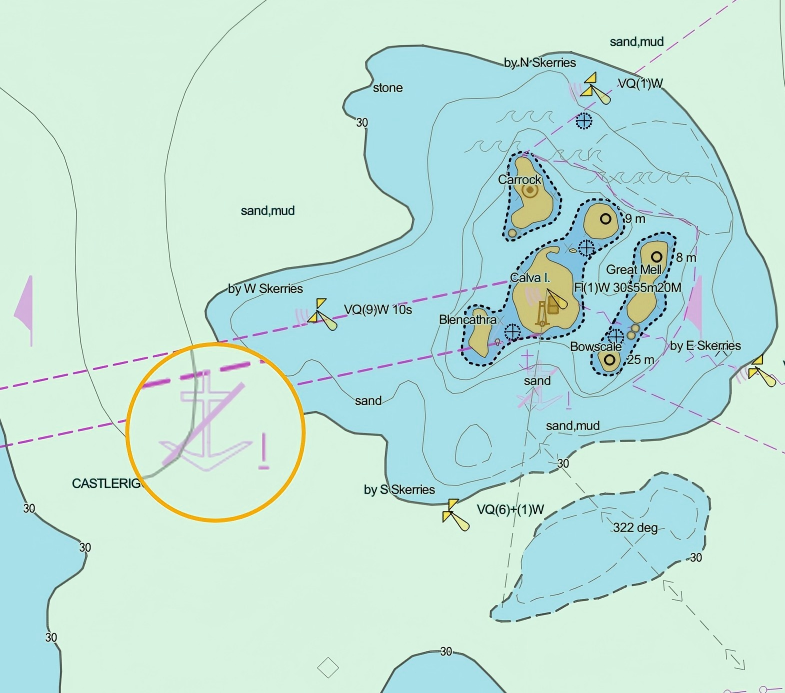
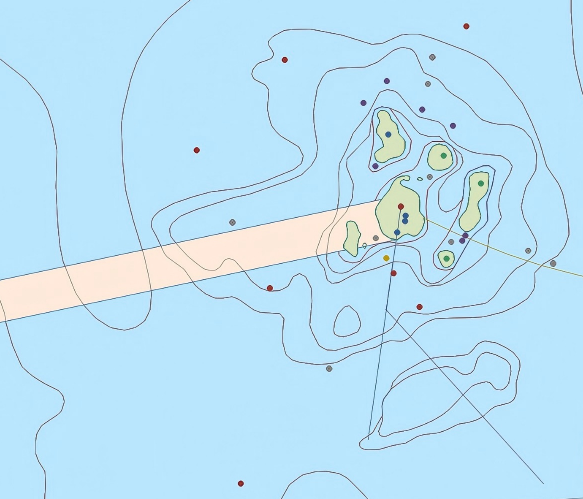
Figure: Standard S-52 Display Figure: Non-Chart Symbology Mode - Font: Select the font style for display. The default is the Arial font.
- Font Size: You can choose or custom input the font size.
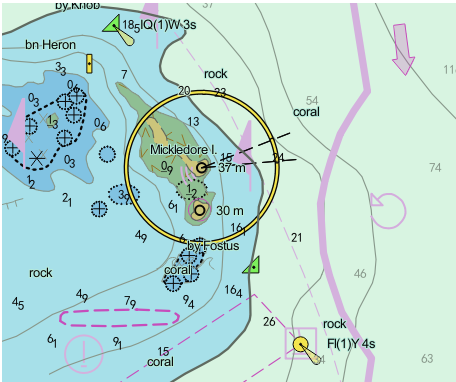
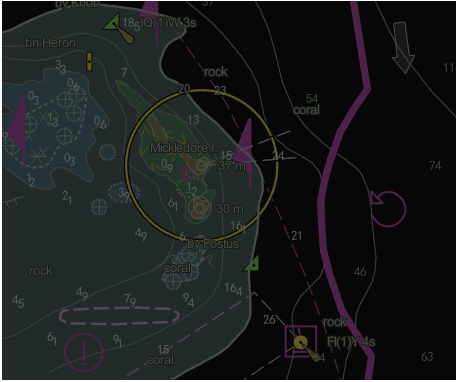
- Vertex Color: Switching the vertex color can improve the detail resolution of the chart based on ambient light conditions, ensuring safe navigation.
- DayLight: Default mode, suitable for daytime lighting conditions, providing good visual effects.
- Dusk: Adapts to dawn and dusk light conditions, reducing eye strain.
- Night: Optimizes the visual experience in nighttime lighting environments.
 |
 |
 |
| Figure: Daylight Mode | Figure: Dusk Mode | Figure: Night Mode |
- Symbol Type: Provides different symbol types to meet various needs and usage habits.
- Simplified Marker: Displays point symbols in a simple form, clear and concise.
- Traditional Marker: Displays point symbols in the traditional way, conforming to nautical standards.
 |
 |
| Figure: Simplified Marker | Figure: Traditional Marker |
- Boundary Type: The boundary type setting affects the accuracy and aesthetics of area display, suitable for different usage scenarios.
- Normal Boundary: Displays area boundaries in a normal style.
- Boundary Symbology: Displays area boundaries in a symbolic form, which is more intuitive.
 |
 |
| Figure: Normal Boundary | Figure: Boundary Symbology |
-
Scale Zoom: Used to control the visibility of chart data at different display scales. For example, if the editing scale of a chart group is 1:80,000 and the scale zoom factor is set to 0.05, the data of that chart group will automatically hide when the map's display scale is less than 1:1,600,000, because the program considers the group data no longer applicable at smaller scales. You can visually view the distribution range of chart group data by enabling "Display Chart Frame"; or set the scale zoom factor to 0 to ensure the chart group data is always displayed. As shown in the following figure:
 |
 |
| Figure: Display Scale Greater Than the Scaled Scale | Figure: Display Scale Less Than or Equal to the Scaled Scale |
 Tip:
Tip:- Scale Settings: 0-1 (decimal point precision up to 22 digits). Setting it to 0 means the chart can be displayed at any scale. Setting it to 1 means displaying according to the original editing scale.
- Editing Scale: In GIS, the recommended map scale used during data capture, digitization, and editing to ensure various geographic features are displayed at the most suitable size and detail on the map, thereby maintaining data accuracy and consistency. You can right-click a chart group in Workspace Manager, select Properties, and in the popped-up Properties panel on the right, view the Editing Scale of that chart.
Related Topics
Nautical Chart Loading and Display