


Feature Description
Depth (point) refers to the vertical distance from the depth datum to the seabed at a specific water location. The depth datum is the reference plane for depth measurement and charted depths, typically using the theoretical depth datum (derived from tidal harmonic analysis as the lowest astronomical tide) or a plane below the lowest observed low tide level to ensure navigation safety. Simply put, depth represents the vertical measurement from the water surface to the seabed.
In SuperMap iDesktopX, depth display settings include 4 key parameters:
- Depth points:
- 1) Safety Depth
As the only display setting specifically for depth points, safety depth directly affects their representation on charts. During chart browsing, depths less than the safety value (dangerous depths) appear in bold black, while safe depths are displayed in light gray, as shown in Figure 3.
In nautical navigation, potentially hazardous features like reefs may exist even within safe areas defined by safety contours. Displaying unsafe depth points thus provides crucial navigational aids. Mariners should set both safety contour and safety depth (usually equal values) to ensure safe navigation.
- 1) Safety Depth
-
Depth contours:
- 2) Safety Contour
This critical parameter distinguishes safe navigation areas from hazardous zones, serving as the primary reference for vessel routing.
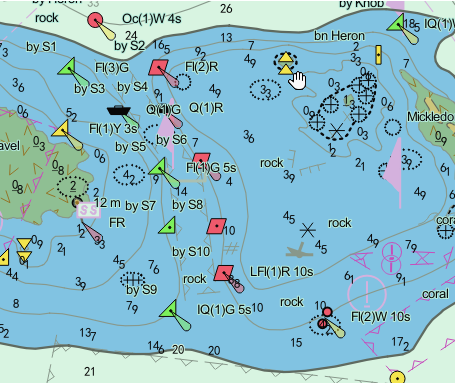
As shown in Figure 3, safety contours are highlighted with thick lines. The lighter-shaded side indicates safe passage areas, while the darker side marks hazardous zones. This distinction remains vital in both two-color (Figure 2) and four-color displays (Figure 1).
- 3) Shallow Contour
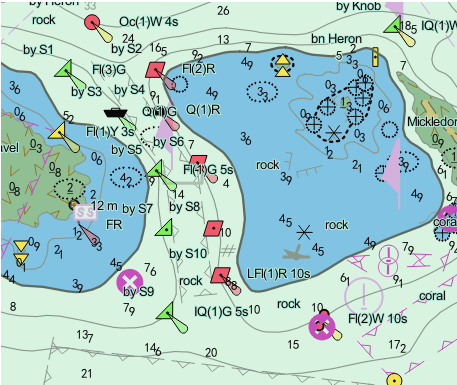
Displayed in four-color mode (Figure 2), shallow contour identifies transitional zones between safety contours and shallower waters, defining "partly safe" zone.
Although waters here are shallower than the safety contour, vessels and ships can still navigate these areas temporarily in specific scenarios (e.g., near ports or narrow channels). Shallow contours help identify such potential passageways.
- 4) Deep Contour
Displayed in four-color mode (Figure 2), deep contour typically sets at twice the vessel's draft, this contour marks deep-water areas.
Displayed in the lightest blue, these zones represent optimal navigation areas. Mariners can adjust this value according to specific needs, such as setting it to the maximum safe anchoring depth.
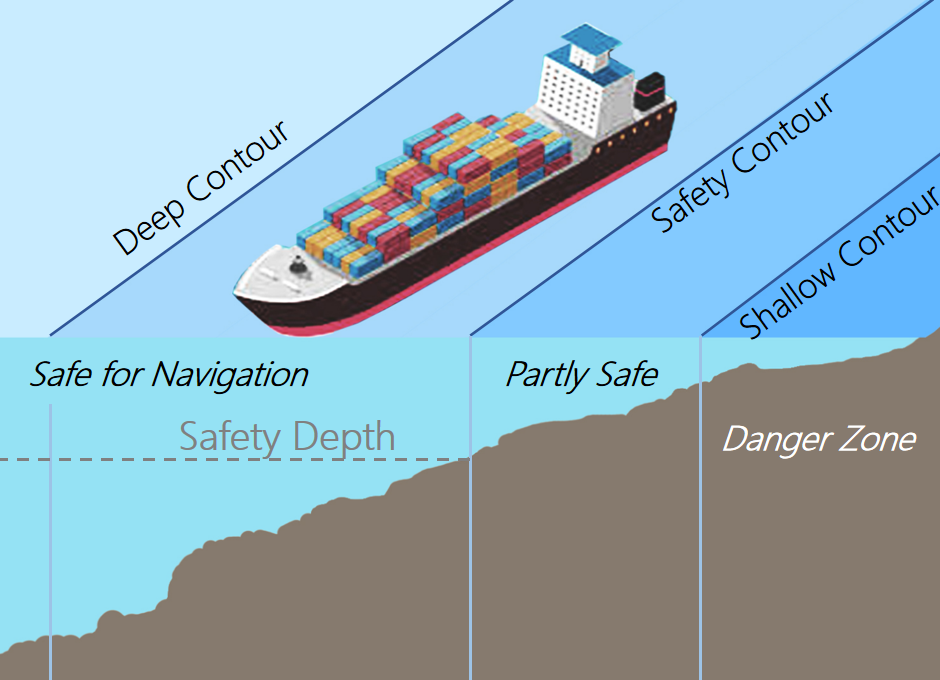

Figure 1: Four-color display Figure 2: Two-color display
- 2) Safety Contour
The above three contours define four distinct navigation zones in four-color display charts. Adjusting these parameters allows mariners to optimize depth visualization according to specific navigation requirements and environmental conditions, enhancing both safety and efficiency. The corresponding display effects in SuperMap iDesktopX are shown below:
 |
| Figure 3: Depth parameters explained in a sample chart |
Steps
- Import your electronic chart data file into SuperMap iDesktopX.
- Load this chart into map window.
- Select the Chart Tab -> Nautical Chart Properties group -> Click the Nautical Chart Properties button. The Nautical Chart Properties panel will appear on the right.
- Expand the Depth Settings group.
- The Display Settings group contains these options:
- Depth Color
- Two-Color: Uses safety contour to divide areas into two colors. This clear visualization suits open waters.
- Four-Color: Uses the three contours mentioned above to create four-color zones. Though more complex, this provides richer information for intricate waterways.
 |
 |
| Figure: Two-color display effects | Figure: Four-color display effects |
- Depth Unit: Select depth measurement units from the dropdown (dm, m, in).
- Safety Depth: Choose or enter values for depth points.
- Safety Contour: Select or input values for safety contour lines.
 |
 |
| Figure: Display effects with 5m safety contour | Figure: Display effects with 20m safety contour |
- Shallow Contour: Select or input values for shallow water contours.
- Deep Contour: Choose or enter values for deep water contours.
 Tip:
Tip: After setting the safety depth, you can enable dangerous depth point display (black bold text) in: Nautical Chart Properties panel -> Filter Settings -> Element Settings by checking Display Soundings. For more about filtering, see: Filter Settings.
Related Topics