


Step 2: Generate Vector Tile
The generated vector tile supports Single process (i.e., starting only a single process on one machine to complete the tile generation task) and Multi-process (i.e., starting multiple processes on one computer or multiple computers) tile generation methods. Here, the multi-process method is selected as it can fully utilize the machine's hardware resources, integrate multiple nodes for parallel tile generation, and effectively improve efficiency.
Operation Steps
- In the current workspace, open the China100.smwu workspace from the sample data, set the data source to read-only, and save the workspace.
- Open the China100_2021 map, in the map context menu, select "Generate Map Tiles (Multi-process)". In the "Generate Map Tiles (Multi-process)" dialog box, select the "New Tiling Task" option, and the "Multi-process: Generate Map Tiles (China100_2021)" dialog box will pop up.
- In the dialog box, in the Parameters area on the right, at "Tile Type:", select the tile type as "Vector Tile".
- By checking the scale level checkboxes on the left side of the dialog box, set the generated scale levels to 1-10 here.
- The vector tile result simultaneously generates vector tiles, tile styles, and tile font files, and stores them in different folders. By default, all three are generated together.
- Path Settings: Set the tile name and export directory.
- Set the storage type to Original. For more information on storage types, please refer to Map Tiles Storage Types.
- Set Tile Generation Range: Click "Next" to specify the tile bounds.
- After all parameters are set, click "Next" to open the "Generate Tile by Mulit-process" dialog box, and set the number of processes for generating tiles by multi-process. For detailed parameter descriptions, please refer to Generate Tile by Mulit-process.
- After settings are completed, click "Generate" to start generating tiles by multi-process. Here, you can view the tile progress by clicking the "Refresh" button.
- When the map cache task is completed, the output window will indicate that the map planar tiles were successfully generated. Under the export directory, the following folders and files will be generated:
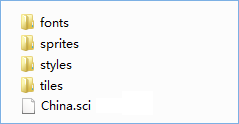
Figure: Vector Tile Result - fonts: Font files used by vector tiles.
- sprites: Style-related icon resources for vector tiles.
- styles: Style description files for vector tiles;
- tiles: Vector tile data. When the storage type is Original, the generated tile format is *.mvt files; when the storage type is Compact, the generated tile format is *.cf files.
Under the tiles folder, tiles are stored in subfolders by scale level, with the folder name being the global level, counting from 0. Subfolders under the level folder are named by the global column number, and the file name is the global row number.
- SCI file: Metadata description file for vector tiles, recording information such as the data's projection, geographic range, and scale levels.
Related Content