


Feature Description
Layer intersection refers to the analytical function of finding the intersection of two datasets. For a detailed introduction to the intersection tool, please refer to the overlay analysis tool.
- The source dataset can be of point, line, or region type. The overlay dataset type can be line or region dataset, and only when the source dataset is a line, the overlay dataset supports the line type.
- The result dataset retains the overlapping parts of the original two datasets. When intersecting lines with lines, a point dataset can be obtained, and the output result type should be selected as point.
- Before performing overlay analysis, ensure that the projections of the data being operated are consistent; otherwise, it may cause the overlay analysis to fail.
Function Entry
- Spatial Analysis tab -> Vector Analysis -> Overlay Analysis -> Intersect.
- Toolbox -> Vector Analysis -> Overlay Analysis -> Intersect.
Parameter description
- Source Data: Select the data source where the datasets to be intersected are located and the datasets to be intersected. Supports inputting multiple datasets for intersection analysis.
- Overlay Data: Select the dataset to be intersected with the source dataset and its data source.
- Result Data: Select the data source to store the result dataset and specify the name of the result dataset.
- Field Settings: Select fields from the source dataset and overlay dataset as selected fields for the result dataset.
- Output Result Type: The output result type of the intersection analysis is consistent with the source dataset type by default. When both the source data and overlay data are lines, the output result type should be selected as point; otherwise, execution will fail. For example, when wanting to obtain the intersection points of road lines and river lines as bridge data, the output result type needs to be set to point.
- Tolerances: Based on the datasets participating in the analysis, the default tolerance value will be automatically given.
After the overlay operation, if the distance between two nodes is less than this value, the two nodes will be merged. The default value of this tolerance is the fuzzy default value of the clipped dataset, which can be set in the fuzzy under tolerances in the vector dataset tab of the dataset properties dialog.
If fuzzy is not set in the dataset properties, the default tolerance here is related to the dataset's coordinate system. For detailed explanation, please refer to Tolerance Description.
- Compare Results: Check this option to open the result dataset, overlay dataset, and source dataset on the map for comparison display after the analysis is completed.
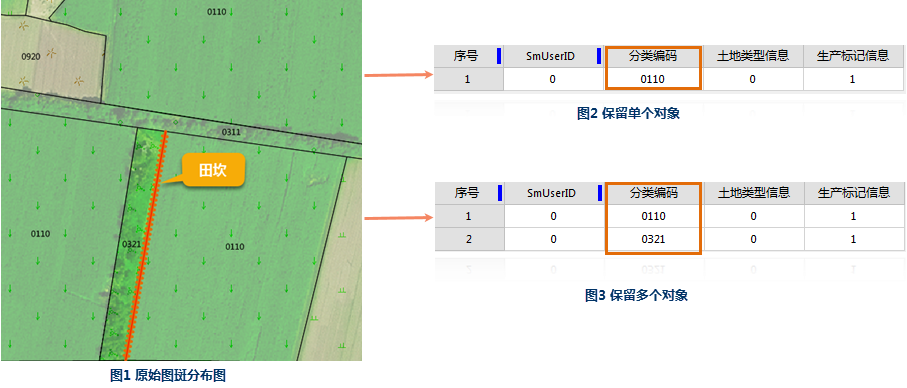
For example: Taking Figure 1 below as an example, the field ridge is at the boundary of two patches with classification codes 0321 and 0110. Now, to calculate the net area of the patches, first calculate the patch area, then deduct the area of the linear field ridge. The linear field ridge is on the edge of the patch, and its area is only deducted by half. Through the intersection operation, if 'Single Object' is checked, the result field ridge belongs to only one patch as shown in Figure 2. If not checked, the result retains both line objects as shown in Figure 3. Then, by specifying the patch ID, deduct the polyline area in the corresponding patch to obtain the net area result.
Related Topics