


Thiessen Polygon Application Example
Case Description
This example is based on national meteorological station data. It constructs Thiessen polygons, reflects the attributes in the point data to the polygon objects, obtains the average rainfall of the area constructed for each meteorological station, produces segmented thematic maps, and analyzes the rainfall conditions of each region.
Data Description
The data used in this case is located in SuperMapsample data Exercise Data\Precipitation. A separate installation package needs to be downloaded. For details, please refer to Get Sample Data Package.
Operation Steps
- In the current workspace, open Precipitation.udbx in the sample data, and create a new file database named Thiessen.
- Click the Spatial Analysis tab -> Vector Analysis group -> Proximity Analysis dropdown -> Thiessen Polygon.
- In the Thiessen Polygon dialog box that pops up, set the dataset to WeatherStation_P, set the result datasource to Thiessen, set the dataset name, and then click the Execute button.
- Open the resulting dataset into the map, and also open the Country_R dataset in the current map. Select the object corresponding to the China region, right-click and choose Select Objects Crop Area. Then in the dialog box that pops up, set the result datasource to Thiessen, set the dataset name, and click OK to obtain the Thiessen polygon polygon data within the China region.
- Add the constructed Thiessen polygon polygon data to a new map, and produce segmented thematic maps. In the thematic map property panel, set the expression to the "Annual Precipitation" field, set the number of segments to 15, and reset the segment values. Finally, you can get the national rainfall distribution map as shown below:
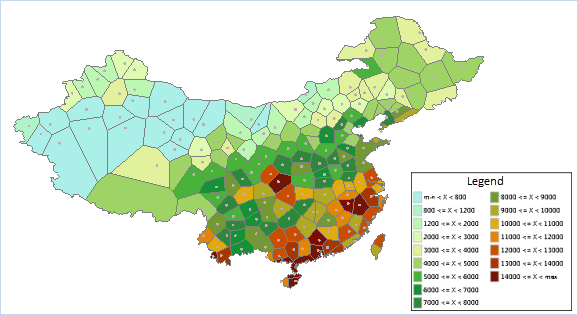
Figure: National Rainfall Distribution Map
Related Topics
Thiessen Polygon Construction Principle