


Optimized hot spot analysis derives parameters based on input data characteristics to perform hot spot analysis, reflecting the distribution of hot spots and cold spots in source data through result zonal data. For example, when the source dataset contains event point data, this function aggregates event points into weighted features, analyzes their distribution range, and identifies hotspot/coldspot patterns across regions.
Analysis Principle
Optimized hot spot analysis evaluates whether event points within specified zones or grids constitute hot or cold spots based on input features, optional evaluation fields, event occurrence areas, and aggregation methods. The result dataset includes Counts, z-scores (Gi_Zscore), p-values (Gi_Pvalue), and confidence intervals (Gi_ConfInvl).
This optimized method (Getis-Ord Gi*) supports both point and polygon event data using fixed-distance conceptual models. It provides four aggregation methods with minimum event count requirements as shown below:
| Minimum Events | Aggregation Method | Minimum Aggregated Features |
|---|---|---|
| 60 | Grid polygon without bounds data: | 30 |
| 30 | Grid polygon with bounds data: | 30 |
| 30 | Polygon aggregation within specified areas | 30 |
| 60 | Snapping distance aggregation | 30 |
Applications
This tool identifies statistically significant spatial clusters of high values (hot spots) and low values (cold spots). It automatically aggregates event data, determines appropriate analysis bounds, and corrects for multiple testing and spatial dependence. For full control over settings, use standard Hot Spot Analysis (Getis-Ord Gi*).
Feature Entry
- Spatial Statistics Tab -> Cluster Distribution -> Optimized Hot Spot Analysis
- Toolbox->Spatial Statistics->Cluster Distribution->Optimized Hot Spot Analysis
Parameter Description
- Source Dataset: Vector dataset (points or polygons) for analysis, e.g., crime incidents or traffic accidents.
- Evaluation Field: Optional for point datasets, mandatory for polygon datasets.
- Aggregation Method:
- Grid Polygon: Creates adaptive grid cells for point counting. Uses dataset bounds if no zonal data provided.
- Aggregation Polygon: Uses predefined polygons for event counting.
- Aggregation Points: Clusters nearby events using calculated snap distance.
- Aggregation Zonal Datasource: Boundary dataset with >30 features.
- Event Range Datasource: Optional grid dataset for analysis bounds.
- Result Settings: Output datasource and dataset name.
Note: Analysis executes directly with evaluation fields; uses aggregation methods otherwise.
Result Interpretation
Result datasets contain four fields: Counts, Gi_Zscore, Gi_Pvalue, and Gi_ConfInvl.
- Counts: Available only for point datasets without evaluation fields.
- High positive z-scores with low p-values indicate hot spots; negative z-scores indicate cold spots.
- Gi_ConfInvl values: ±3 (99% confidence), ±2 (95%), ±1 (90%), 0 (no significance).
| Z-Score | P-Value | Gi_ConfInvl | Confidence |
|---|---|---|---|
| <-1.65 or >1.65 | <0.10 | ±1 | 90% |
| <-1.96 or >1.96 | <0.05 | ±2 | 95% |
| <-2.58 or >2.58 | <0.01 | ±3 | 99% |
Example
Sample Data: Download OptimizedHotSpot sample data (extract after download).
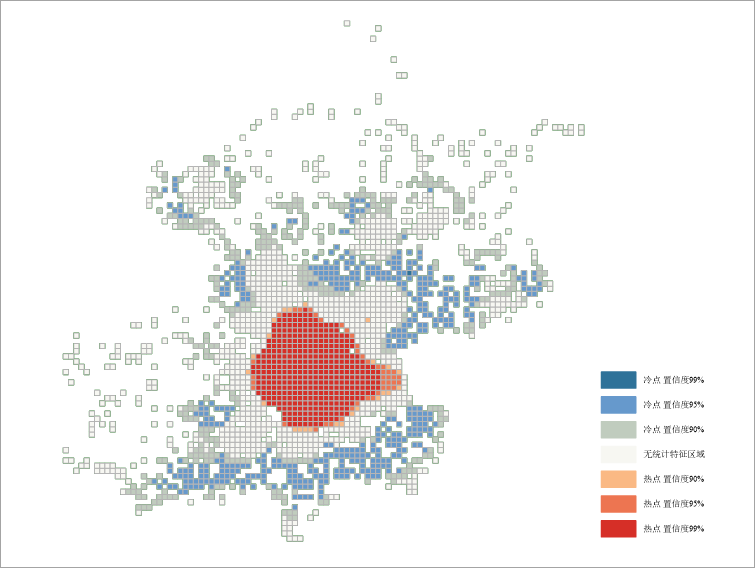
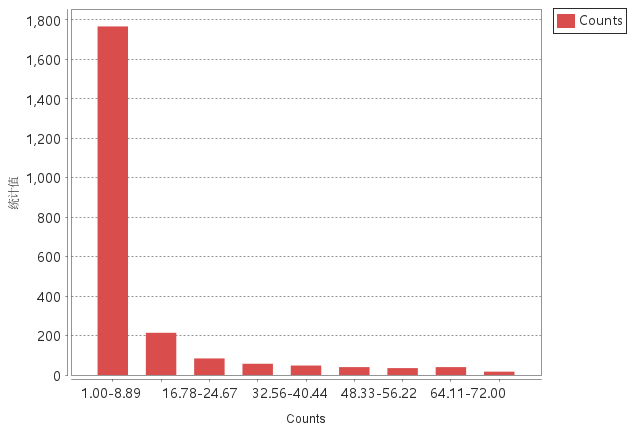
Case 1: Grid polygon method applied to Beijing Weibo check-in data (WeiBo_P):
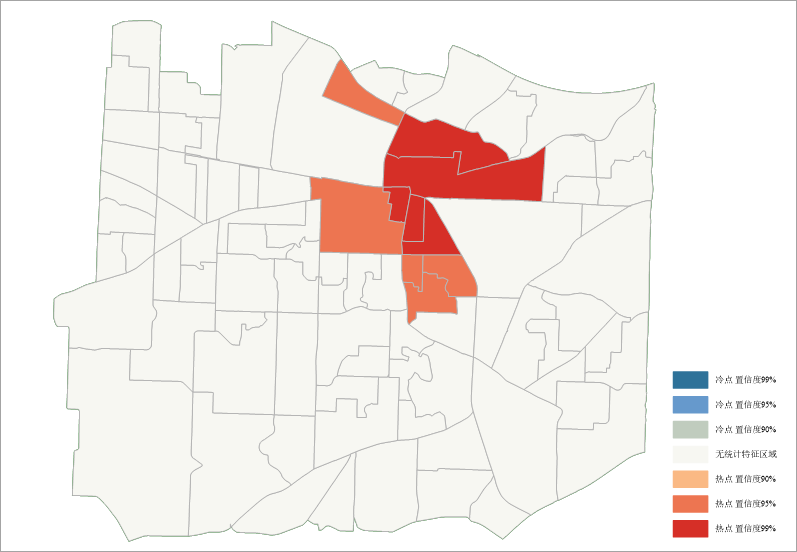
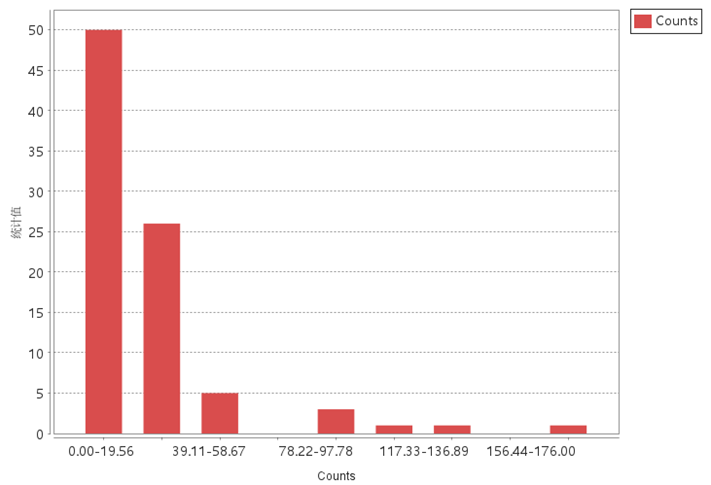
Case 2: Polygon aggregation method applied to 911 call data (T911Calls):
Related Topics
Hot Spot Analysis (Getis-Ord Gi*)