


A Graduated Color Thematic Map utilizes attribute values from a specific field in a layer, divides these values into continuous ranges, and represents each range with distinct symbols (line styles, fills, or colors) to visualize the overall distribution of the property field. This method effectively demonstrates relationships between attribute values and geographic regions. It typically displays quantitative characteristics of areas such as regional sales figures, household income, GDP, or ratio information like population density. Graduated Color Thematic Maps support both DEM layers and GRID layers.
Click the "Thematic Map" tab's "Graduated Color Thematic Map" button to generate a default map. Users can then modify parameters to create customized graduated color thematic maps. The illustration below shows a sample map created using 2000 GDP data from five provinces: Henan (5137), Hubei (3028), Hunan (4276), Jiangxi (2003), and Anhui (3691). The GDP values are divided into three ranges: minimum~3000, 3000~4000, and 4000~maximum, each represented by distinct colors.
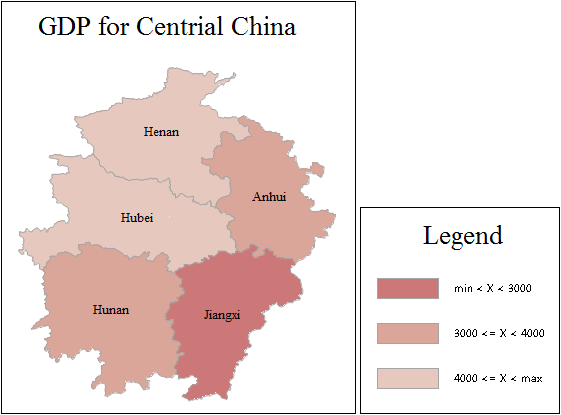 |
The map clearly shows Jiangxi in the first range (<3000), Hubei and Anhui in the second range (3000~4000), with Henan and Hunan in the highest range (>4000).
Graduated Color Thematic Maps can be created for any vector layer (point, line, or polygon). To create one, first set the target vector layer as current in the Layer Manager. Created thematic maps remain editable. For detailed editing instructions, see Editing Thematic Maps.
Two Methods to Create Graduated Color Thematic Maps:
 Creating New Graduated Color Thematic Maps
Modifying Existing Graduated Color Thematic Maps
 Related Topics