


Browse ENC
Feature Description
SuperMap iDesktopX provides flexible and efficient chart browsing features to help you quickly accomplish navigation, analysis and management tasks. This page explains how to browse charts and set visible scales for display control.
Load Charts to Map
Loading charts to a map is the fundamental operation for chart browsing. SuperMap iDesktopX offers two methods to load charts:
Method 1: Add Charts to New Map
- Select the target chart group in the workspace manager. Use Shift or Ctrl keys to select multiple chart groups.
- Right-click the selected chart groups and choose Add to New Map from the context menu. This creates a new map displaying the complete chart.
- For a single chart group, you can directly double-click to open and display it.
Method 2: Add Charts to Current Map
- Select the target chart dataset groups. Use Shift or Ctrl keys to select multiple groups.
- Right-click the chart groups in the workspace manager and select Add to Current Map from the context menu. This allows displaying multiple charts in the same map.
- For details about displaying multiple charts, refer to Integrated Land-Sea Display.
Display Control
For chart layers loaded in the map, you can adjust their display effects through basic display control settings.
Set Layer Properties
- Click the target layer in Layer Manager. Select Layer Properties from the context menu to open the Layer Properties panel on the right.
- Expand the Display Control group to configure related display settings.
Visible Scale Settings
When loading S-100 compliant electronic charts to the map, abnormal display usually relates to visible scale settings. Configuration instructions:
- Chart group visible scales:
- Chart groups compliant with S-101, S-127 and S-131 standards contain DataCoverage datasets. The maximumDisplayScale and minimumDisplayScale fields define the maximum and minimum visible scales controlling data visibility. These fields are currently read-only.
- When chart groups are loaded, each group displays as a layer. The Display Control section in Layer Properties shows default scale values derived from DataCoverage dataset fields.
- Layer visible scales:
- If charts don't display properly, verify if the current map scale is within the default visible range:
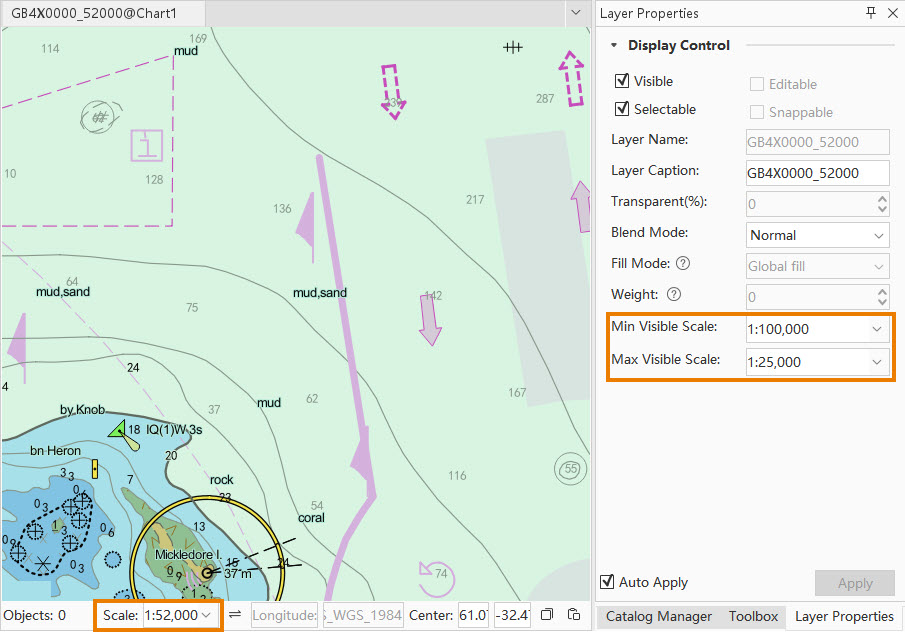
- Check and adjust visible scales in the Layer Properties panel. Zoom the map to appropriate scale ranges for proper display.
- Alternatively, directly modify layer visible scale settings and save changes to the workspace. Note: This modification won't affect original DataCoverage field configurations, but new settings will apply when reopening the map.
- If charts don't display properly, verify if the current map scale is within the default visible range:
Related Topics