


Feature Description
Electronic Nautical Chart (ENC) represents a significant breakthrough in maritime navigation, providing robust safeguards for maritime safety. With the rapidly growing demand for GIS platforms in the maritime industry, SuperMap iDesktopX has achieved leapfrog development in the GIS industry through comprehensive support for ENC technology.
SuperMap's breakthroughs in storage, visualization, and publishing realize the integration and publication of chart data with terrestrial data, overcoming the traditional chart's "water-centric, land-neglected" limitations to truly achieve Land-Sea integration. This capability addresses the strong demand for fusing nautical charts with land maps, providing perfect solutions for maritime transportation, comprehensive Land-Sea emergency response, and the development of marine resources and inland waterway resources.
Three Key Features of Land-Sea Integration
- Integrated Storage
Standard chart data (*.000) is stored as dataset groups, enabling unified management with other GIS datasets. This eliminates separate maintenance for land and chart data, significantly reducing upkeep costs. - Integrated Visualization
Supports overlaying stitched chart data onto maps for seamless integration with 2D land maps, eliminating the need for separate display systems.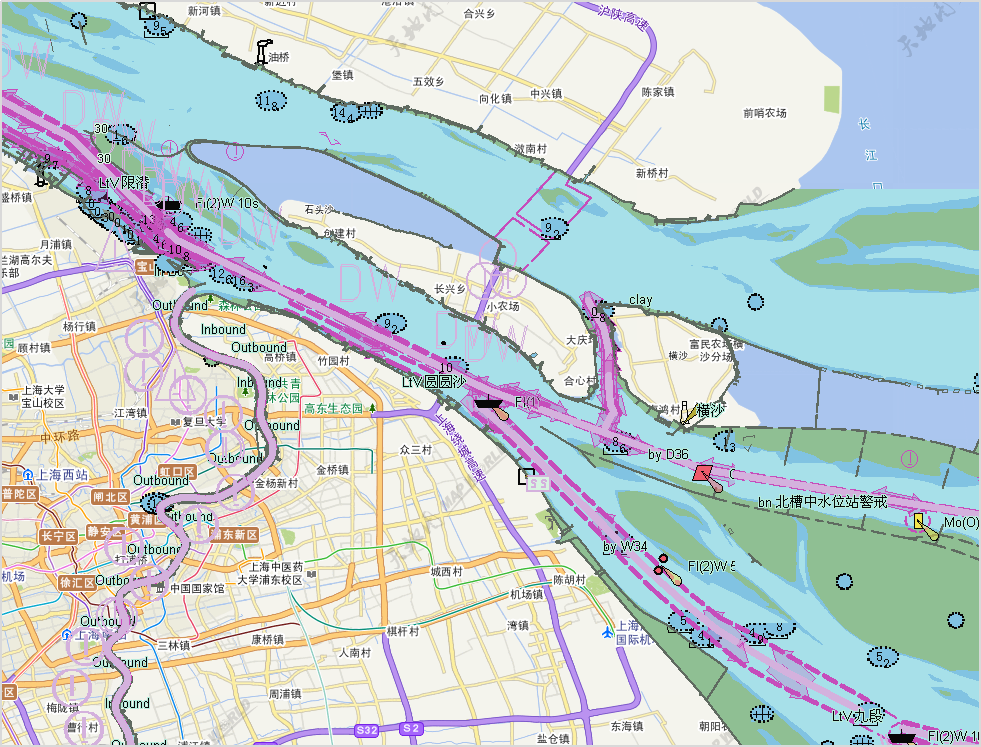
- Integrated Publishing
Enables tile generation and direct server-side publishing of nautical charts or integrated Land-Sea maps to meet multi-scenario requirements.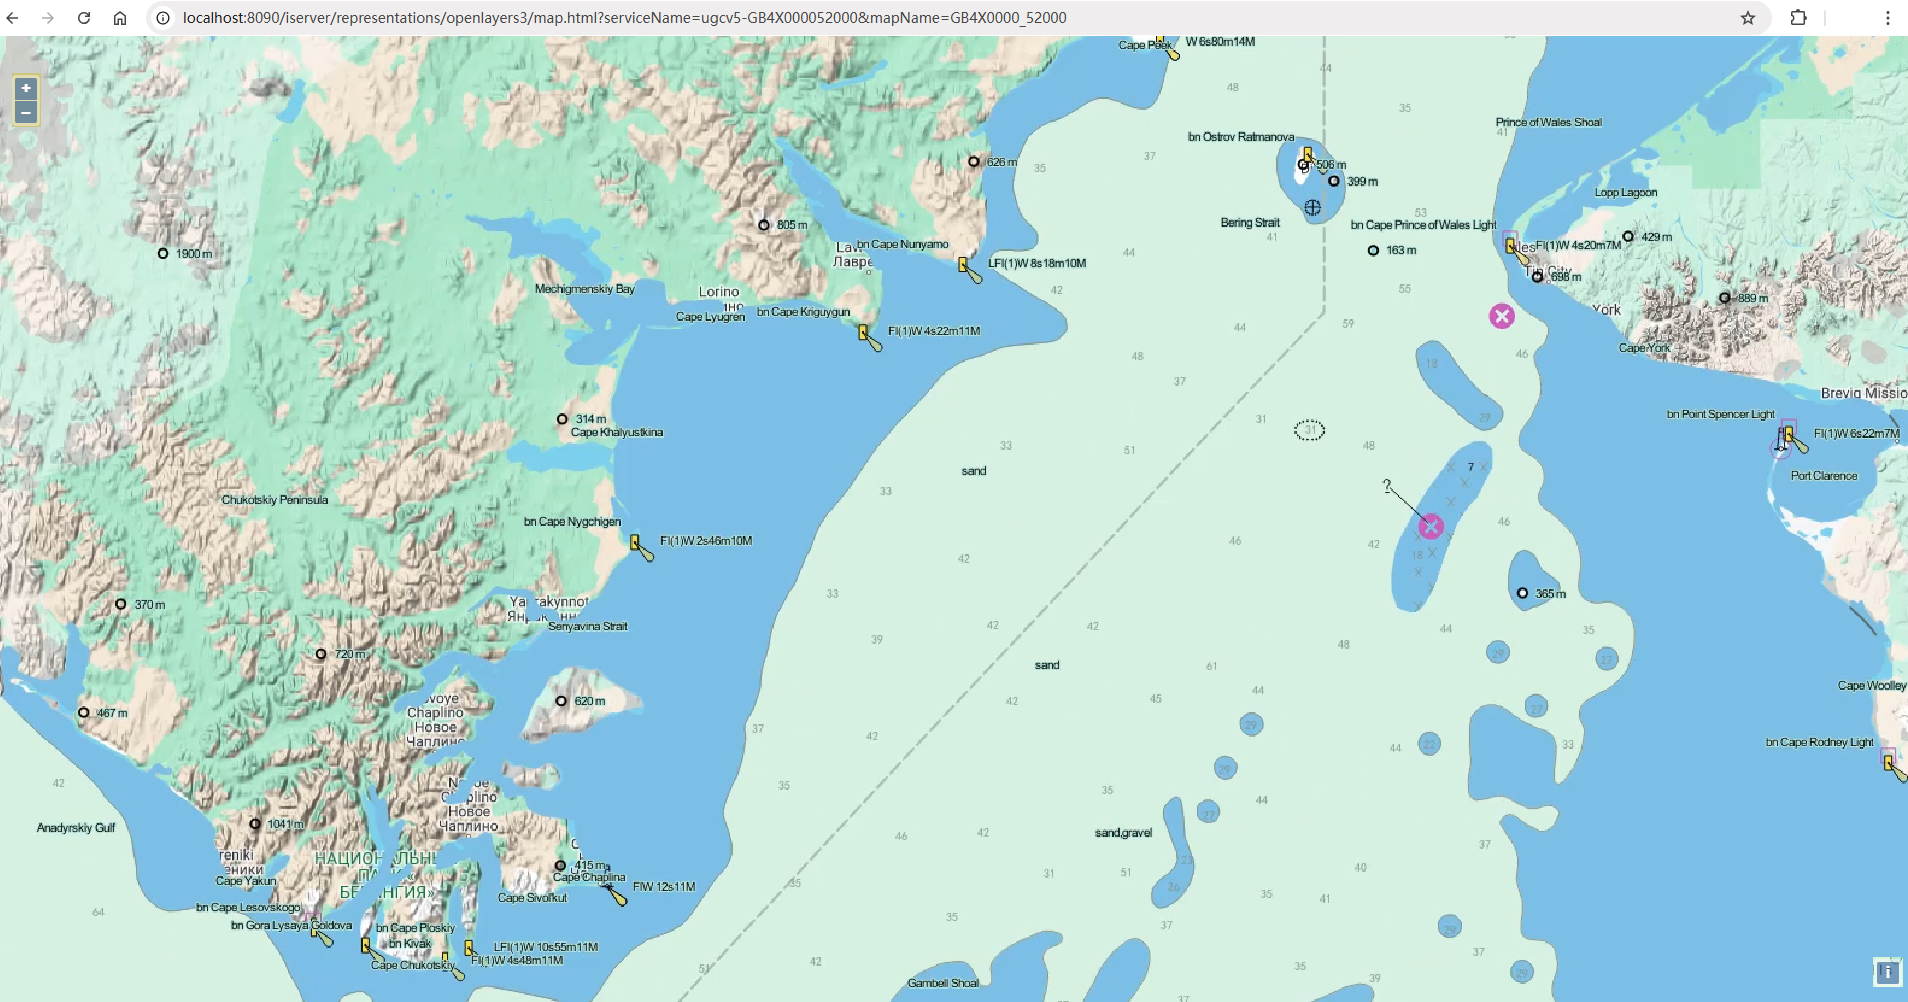
Application Example
Key steps to implement Land-Sea integration storage and visualization:
Data Specification
- S-57 chart data: Located in [Product Installation Folder]\templates\Chart\Data\01_Browse, files US1BS01M.000 and US1WC04M.000
- World vector map: Contains national administrative boundaries in [Product Installation Folder]\templates\Chart\Data\01_Browse\World_shp, file Country_R.shp
Main Steps
- Import *.000 files
- Create datasource : In Workspace Manager -> Right-click datasource node -> New File Datasource..., name local file database as "ChartBrowsing". This generates ChartBrowsing.udbx to store chart data and other spatial data.
- Import data: Workspace Manager -> Right-click ChartBrowsing -> Import Nautical Chart Data -> S-57..., select US1BS01M.000 and US1WC04M.000 files from [Product Package Root]/templates/Chart/Data/01_Browse. Uncheck the Editable option during import, keep other parameters default, and execute Import. This creates chart groups US1BS01M_3500000 and US1WC04M_3500000 corresponding to *.000 files.
- Browse chart data
- Right-click the US1BS01M_3500000 node -> Add to New Map to view S-52 compliant chart data in the automatically opened map.
- Drag and drop the US1WC04M_3500000 node to the current map to view two chart sheets together.
- In the Chart Tab -> Execute Nautical Chart Properties to set text font size, day/dusk color modes, depth zone coloring in the properties panel. Settings apply to all chart groups in the current map. See Chart Browsing for details.
- Overlay with land data
- Workspace Manager -> Right-click Datasources -> Open File Datasource..., select Country_R.shp. Default parameters create Country_R datasource.
- Drag region dataset Country_R to current map. In Layer Manager, move Country_R@Country_R layer to the bottom to observe overlay effect.
- With no objects selected, right-click map -> Save Map, name as ChartBrowsingMap.
- In the Start Tab -> Execute Save Workspace, specify path and name TestWorkspace.smwu.
- Adjust land map style
- In Layer Manager, double-click Country_R@Country_R layer. Use the right-side Layer Style panel to adjust the display style for better land-sea overlay effect.
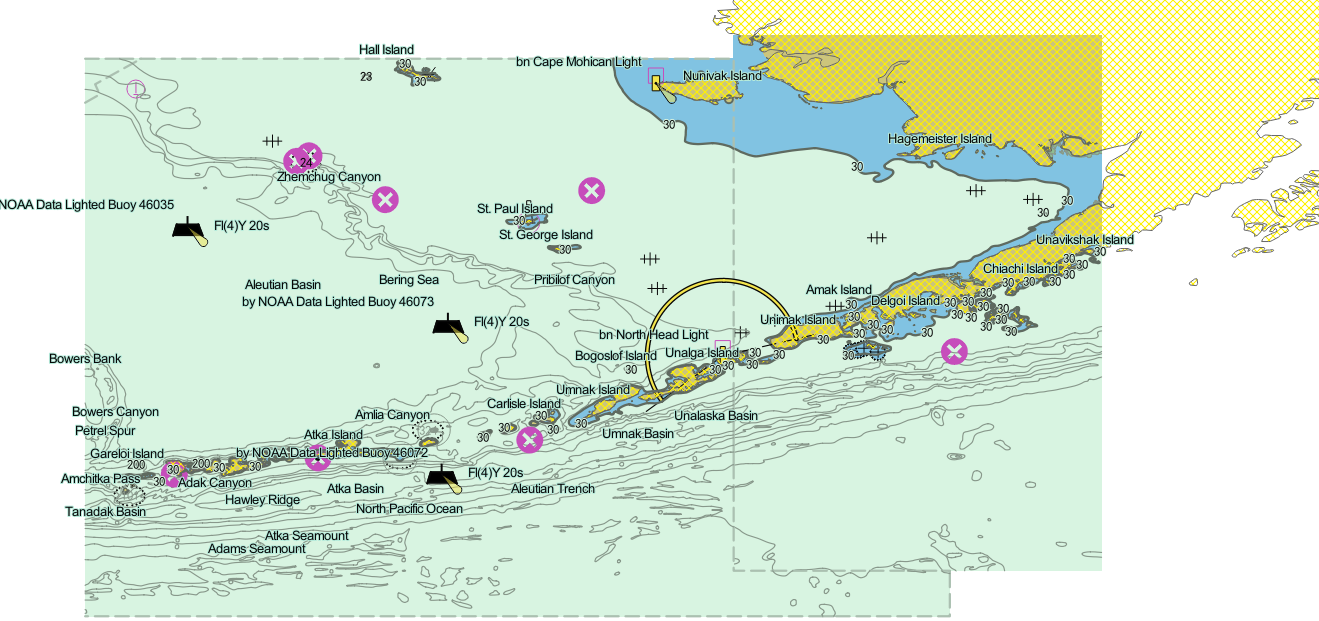
- In Layer Manager, double-click Country_R@Country_R layer. Use the right-side Layer Style panel to adjust the display style for better land-sea overlay effect.
Related Topics