Map description
The hourly maximum wind speed map of the Xizang reflects the differences of the maximum instantaneous wind speed, wind direction and wind power level in the Xizang area on that day. The map uses Temporal Data, which is presented in a dynamic way, and visually shows the wind situation in the Xizang area on that day.
Detailed description of the data
Source Data includes meteorological stations, wind speed, wind direction, wind power and other data, in Excel format, downloaded from the China Meteor ological Data Network . The rest of the data are downloaded from the 1:1 million national basic geographic database of the National GIS Resource Directory Service System .
Detailed description of data in Workspace is shown in the following table:
| Datasource Name | Dataset Name | Data classification | Dataset Type | Explain |
| BaseMap | AdminstrationCenter_P | Administrative elements | Point | Administrative Center |
| Boundary_L | Line | National boundaries | ||
| City_L | City (state) boundary | |||
| Xizang_R | Face | Xizang Autonomous administrative profile | ||
| Mountain_P | Natural elements | Point | Major mountain peak and mountain passes of that Xizang. | |
| River_L | Line | Xizang major rivers | ||
| Water_R | Face | The main waters of the Xizang | ||
| Buffer | Auxiliary elements | Face | As an auxiliary face of the map ribbon | |
| Legend | CAD | Legend | ||
| Import | Wind 0, etc. | Preprocess the data | Point | Xizang hourly wind speed data |
| InterpolatorClip | WindPower 0, etc. | Interpolated data | Grid | Hourly Wind Grid of Xizang after Interpolation Clipping |
| TimeText | Time _ 0 _ P etc | Map name data | Point | As an aid to the dynamic display of map names |
| WindPower | WindPower 0 R, etc. | Isosurface data | Face | Xizang Hourly Wind Power Isosurface Data |
Data Processing
- Data Import
Create File Datasource, set the Data Import downloaded from the China Meteorological Data Network as point data, check the "Import Spa tial Data" "checkbox, and set the coordinate field: X/Longitude as" Longitude ". Y/Latitude is Latitude.
- Data Processing
(1) Add date type field
Add the date type field "TIME" of the monitoring time pointfor the imported monitoring result point data to prepare for the subsequent use of the Temporal Data tool. Refer to the Prepare Temporal Data.
(2) Update attribute data
Open the monitoring result point data attribute table and use Attribute Table-& gt; Edit- The Update Column tool updates each monitoring time point one by one to the attribute table of the monitoring result at the corresponding time.
(3)Interpolation Analysis
Since the monitoring data of meteorological stations are sample data, Spatial Analysis-& gt; is required. Raster Analysis -> Interpolation Analysis -> The Inverse Distance Weighting tool generates a grid, and the Xizang surface data is used as the Result Dataset range on the Environment page, so as to obtain the approximate value of the area without monitoring stations.
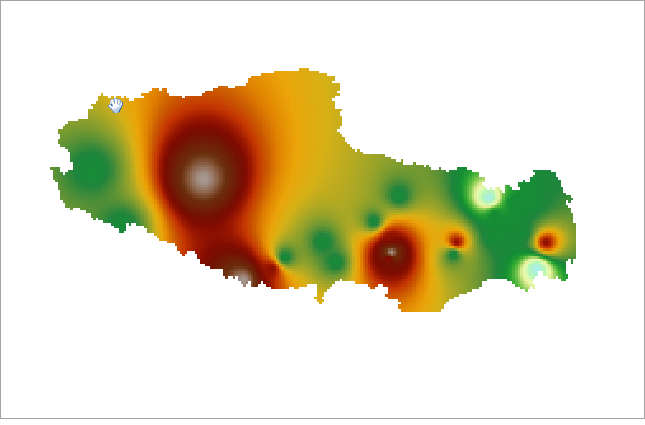
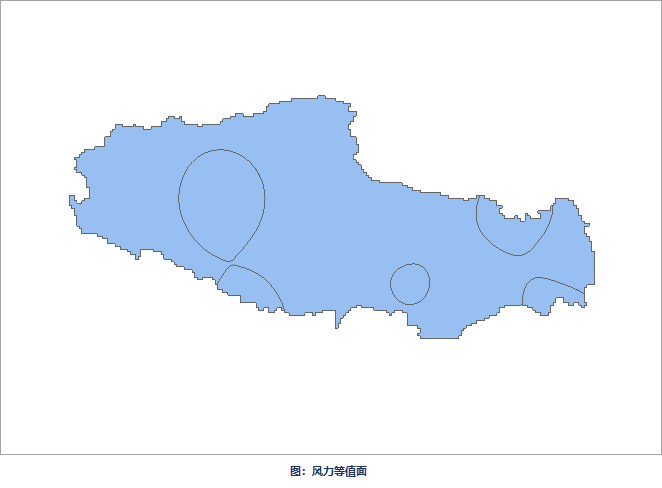
(4) extracting a wind power isosurface
;Use Spatial Analysis-& gt; Raster Analysis -> Surface Analysis -> Extract All Isoregions tool, extract wind power isosurface from the grid generated by interpolation in (3), and set the isosurface distance as 1 (the isosurface distance can be flexibly set as required).
Drawing process
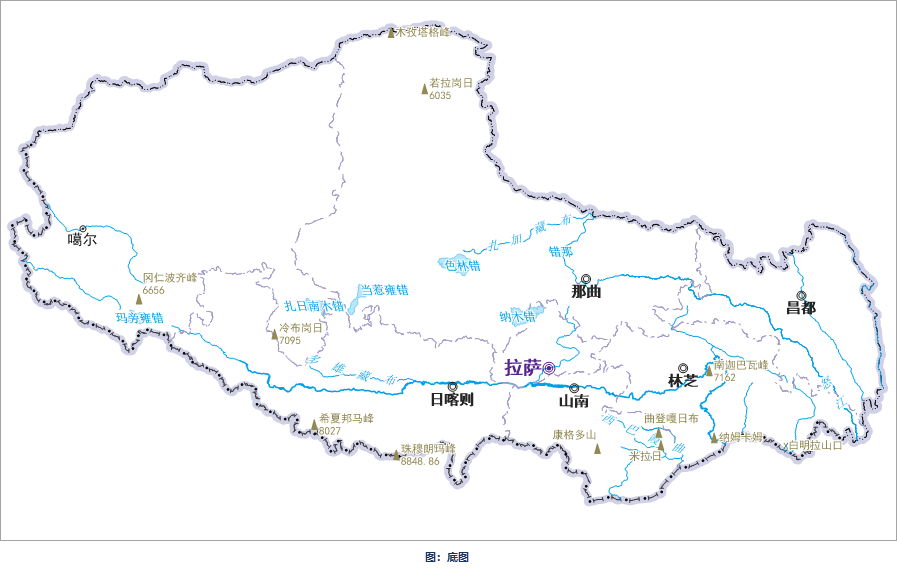
- Make a base map
Add administrative elements, natural elements such as water areas and mountain peaks, configure colors and symbols for them, and make name annotations as base maps.
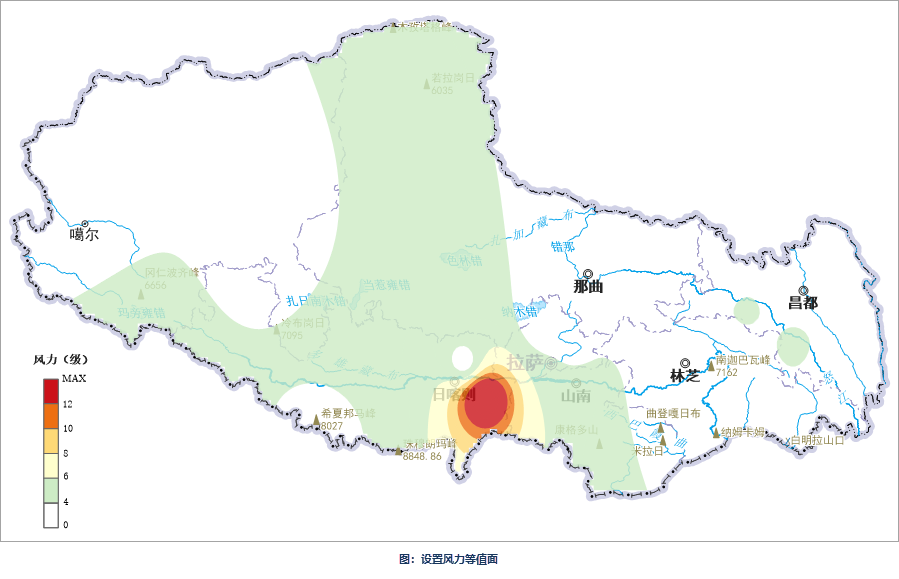
- Configure the wind iso-surface Make a Graudated Colors Map
for the wind iso-surface and configure the ribbon. When Temporal Data is used to make Graudated Colors Map, you can first make a thematic map as a template, and use this template for other data, so as to reduce the time of drawing.
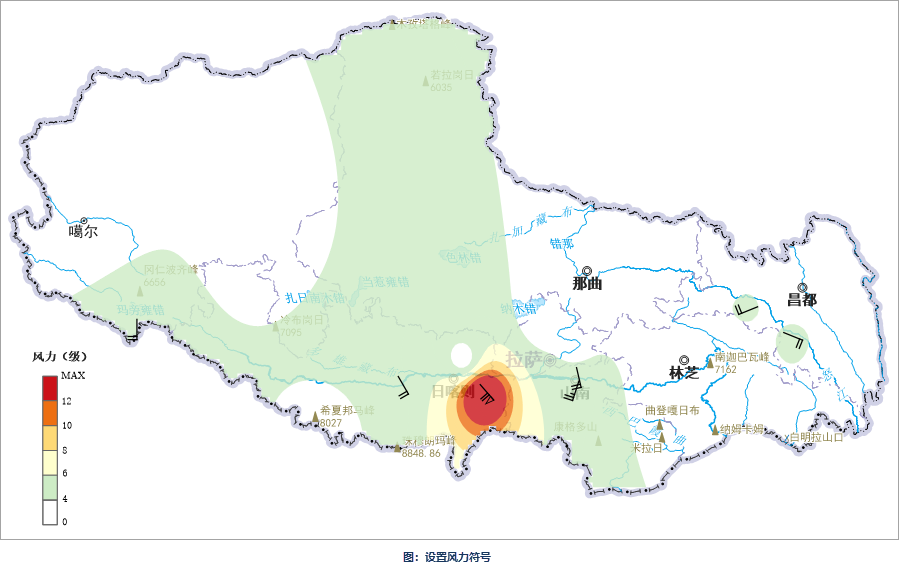
- Sets the wind symbol
The wind symbol is composed of tail feather and wind pole, which indicates the wind speed and direction. In addition to the symbol level, the symbol direction should also be considered when setting the symbol. According to the wind power level legend in this figure, the wind power is greater than level 4 (wind power & gt; 4) Set the wind power symbol at the monitoring station, and the specific steps are as follows: right click the wind speed point data, make Unique-values Map, and select "windpower" in the attribute Page SetupSingle value expression. Check the Rotation angle "checkbox and Set fields to the WIN _ D _ INST". The points with the wind power value of "0-3" are not displayed, and the rest are set with the wind power symbol of the corresponding level according to the wind power value.

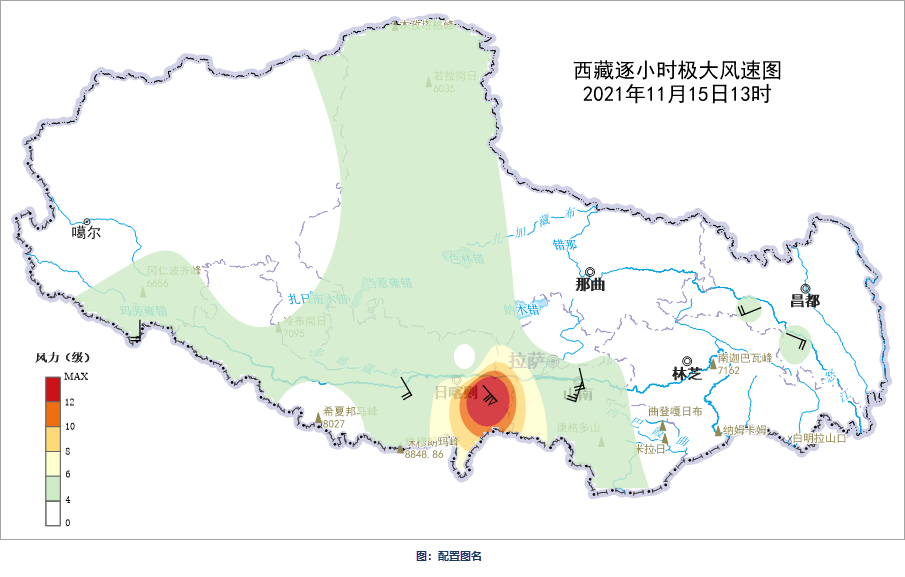
- Make a picture title
In order to use the Temporal Data tool to realize the hourly dynamic display of map names, it is necessary to make a point Datasource to store the map names of 24 monitoring time points, and add the date field corresponding to the time for each point data.
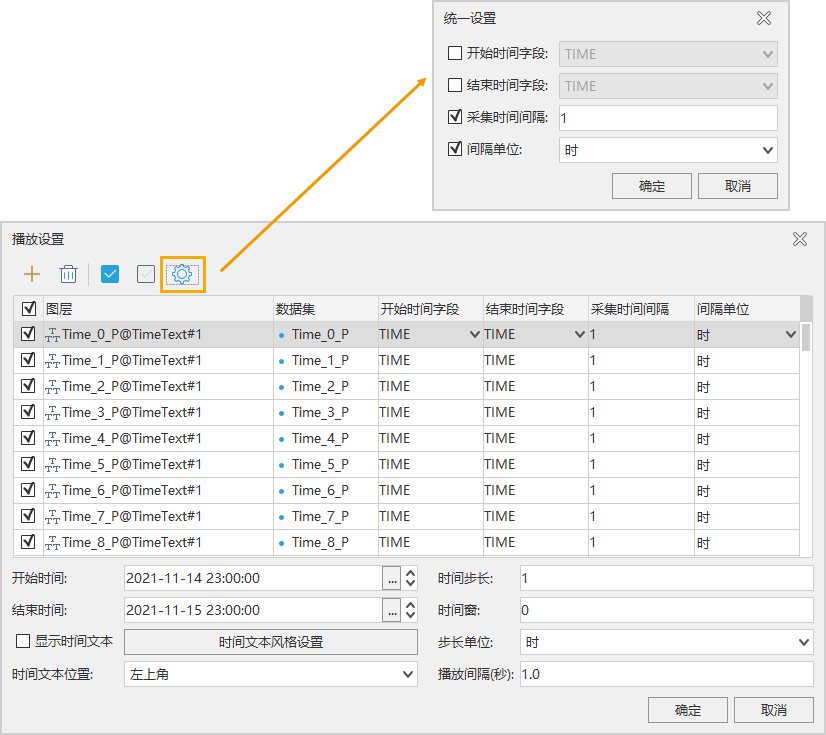
- Set Temporal Data
Click the Map tab-> Browse- Temporal Data ", click the setting button in the upper right corner of Map, add the wind power equivalent surface, wind power symbol and Temporal Data of the map name on the Play Settings page, and the start and End Time Field are" TIME " (that is, the time point of data monitoring) by default. Set Data Time Step to "1" and Step Unit to "Time", and then set parameters such as Time Step and playback interval. Refer to the Play Temporal Data for more parameter details.
Graphic display