


SuperMap iMaritimeEditor supports viewing S-101 data in two ways: direct open and import.
Open directly
Directly opening a *.000 file that conforms to the S-101standard will be in read-only mode and cannot be edited. There are two specific methods of operation:
- Drag the *.000 file directly to the work interface, and in the Open: Chart 000 file pop-up window, set the Standard type to S-101 in the Parameter Settings. The results of the settings are displayed before the File Name for easy review. The default parameter for Standard Type is S-57. If the standard type is not set correctly, the data will not be imported correctly.
- Or directly select and open the *.000 file through the Open File Datasource function, and you also need to perform Parameter Settings in the Open: Chart 000 file pop-up window.
Import Nautical Chart Data
The Import Nautical Chart Data can be used to edit, process, and produce Chart Data.
Supports the import of S-101 compliant *.000 Data into a File Database, Database-type Datasource (PostGIS or DMPlus), or EMS Datasource. Note that the Datasource of the Import Nautical Chart Data cannot be a read-only Datasource.
The specific operation is as follows:
- Open or create a new Datasource in Workspace to hold *.000 files.
- Select the Datasource to be Import Nautical Chart Data, and select Import Nautical Chart Data-> S-101 in the Context Menu; Alternatively, select the Datasource to be Import Nautical Chart Data, Start tab-> Data Processing group-> Data Import drop-down menu-> Chart-> select S-101.
- Select one or more S-101 *.000 files in the Import Nautical Chart Data pop-up box and click Open.
- The selected files are displayed in a list in the Import S-101 pop-up box, and the following parameters are provided:
- Source File: Displays the name of the imported Chart Data and cannot be edited.
- Source Data: Displays the path of the imported Chart Data and cannot be edited.
- Target Datasource: Displays the name of the Target Datasource. Other Datasource in the Current Workspace can be selected from the drop-down list.
- Projection Transformation: Sets whether to convert Projection Type to Mercator projection.
- Since Chart Data is typically produced and distributed as WGS84 Geographic Coordinate System (epsg: 4326), the specific requirements of Projected Coordinate need to be considered when importing.
- Mercator projection has the advantage of facilitating the safe navigation of ships, and is the most widely used Projection Type of navigation charts in the world. Because the Mercator projection has a special feature: all compass equiangular lines, or loxodromic lines , are straight lines under the Mercator projection, which is very suitable for navigation.
- Check the box to convert the Projection Type to Mercator projection. After projection, when browsing the chart in Map, the map unit is changed to meters, which is convenient for viewing the navigation distance and so on.
- Encode Type: Specifies whether to save Chart Data in a compressed manner to save disk space. The system defaults to unencoded, that is, compression is not used. Single-byte, double-byte, three-byte, and four-byte Encode Types are also available. For more details, please refer to Dataset Compression Encode Type .
- Import Null Dataset: Select this check box, and the imported Dataset will include the empty Dataset in Source Data.
- When importing multiple *.000 files, you can quickly select the files through the Select All, Invert Selection, and Uniform Settings buttons on the pop-up toolbar. And set Target Datasource, Encode Type, and Projection Type for multiple files.
- After setting the above parameters, click the Import button to complete the import of S-101 Chart Data. The data is displayed as a Chart Group under the corresponding Datasource in Workspace Manager.
Browse Chart Data
After the S-101 file is imported as Chart Group, click or hold Shift to select the Chart Group to be browsed in batch, and select Add to New Map or Add to Current Map in the Context Menu. Enables quick browsing of Electronic Chart data.
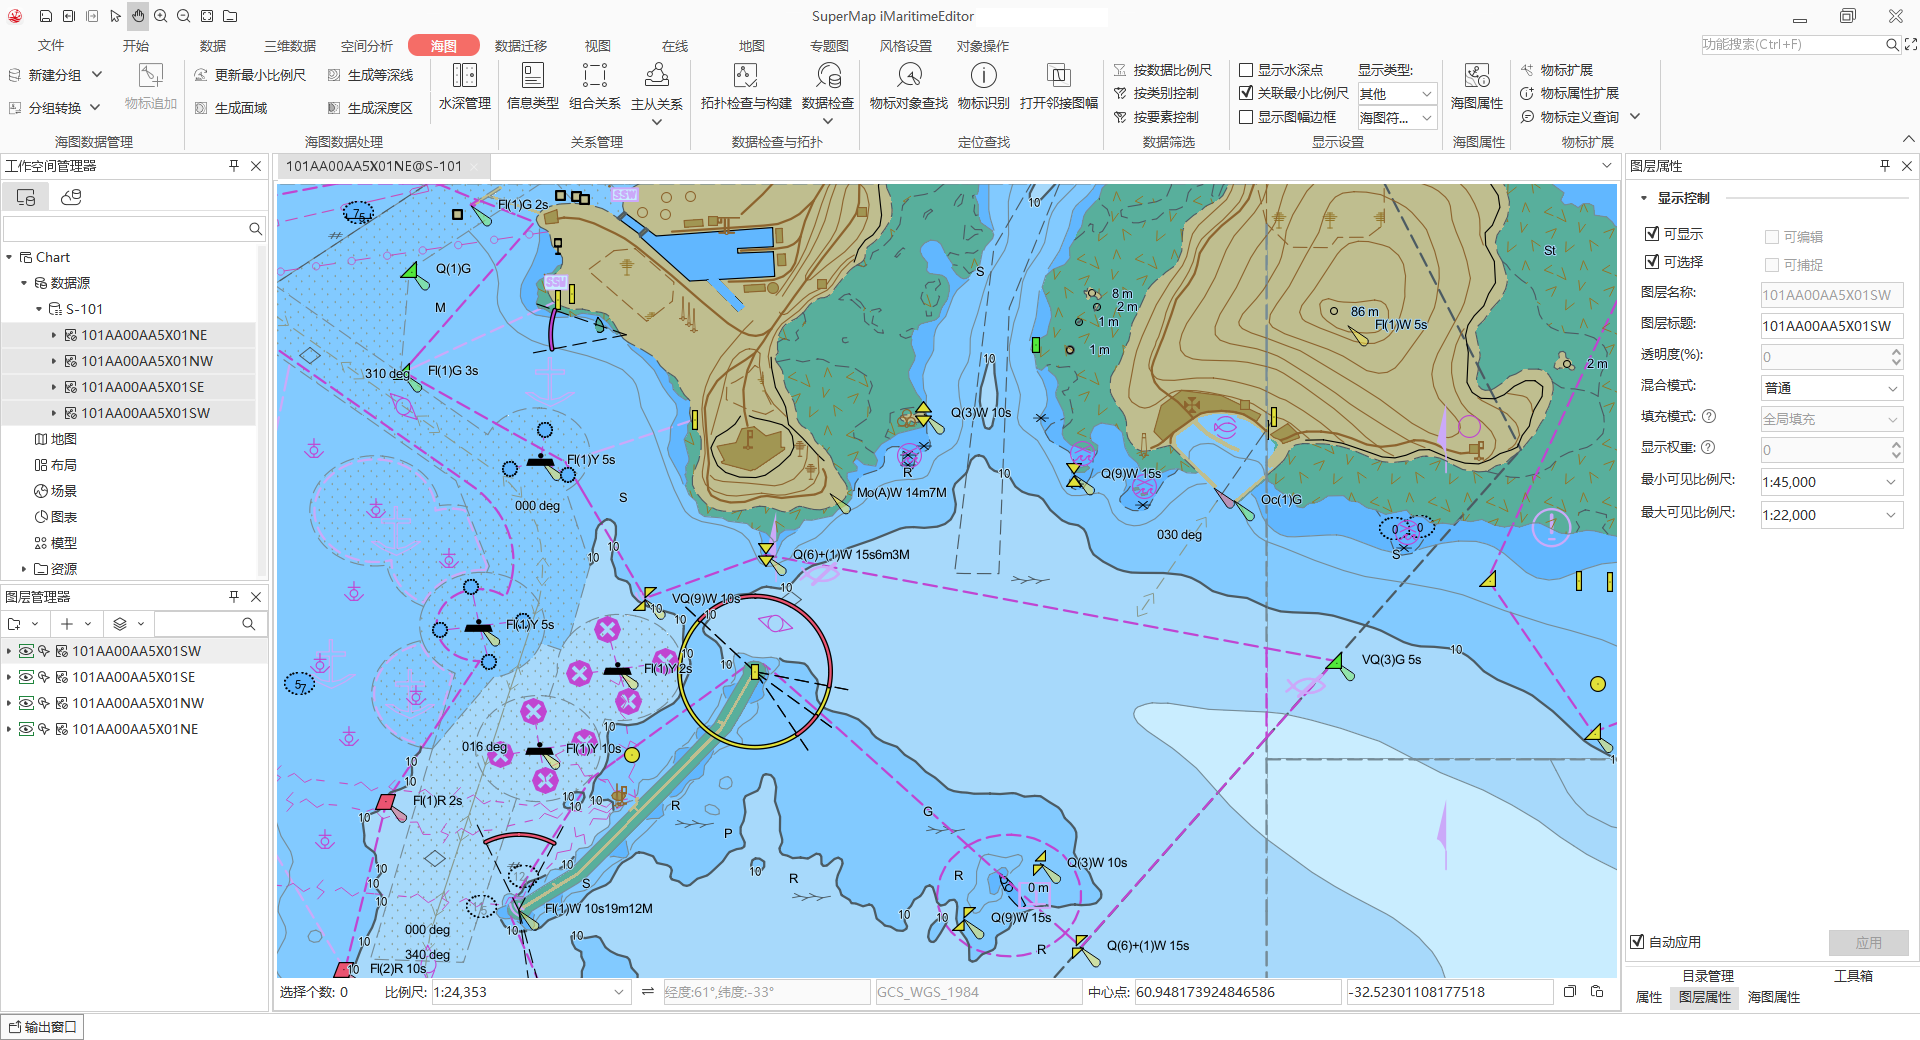
- Visible Scale of the chart:
- Chart Group (S-101, S-127, S-131) contains DataCoverage Dataset, The maximumDisplayScale and minimumDisplay Scale fields represent the maximum and Minimum Visible Scale, respectively, that control the visible range of the data in this group. These fields cannot be modified at this time. When
- you Chart GroupAdd to Map, each grouping is displayed as a layer. The Display Control section in Layer Properties shows Minimum Visible Scale and Maximum Visible Scale, which are default values from the DataCoverage Dataset.
- Visible Scale of the layer:
- The Chart Group for
- Add to Map is not displayed in the Map because the layer may not be in the default visible scale display range ? You can right-click the layer in Layer Manager, select Layer Properties, view Visible Scale Bar in the Layer Properties panel on the right, and zoom the scale bar of Current Windows to the appropriate size.
- Or modify the Visible Scale Bar? directly and save the changes to Workspace. This does not affect the original fields of the DataCoverage Dataset, but the next time you Open Map, the visible scale of the layer is displayed according to your previous settings.
View *.001 data
According to IHO specifications, the initial version of the Chart Data file has an extension of *.000, and subsequent update files have extensions of * .001 through *.999 . Add 1 to the update number of each edition.
When viewing the updated * .001 to *.999 files, You must place the update file and the corresponding *.000 file in the same directory and keep the same name.
Using the steps for Import Nautical Chart Data, Application will automatically recognize that an update file with the same name is merged into the *.000 file. Therefore, when selecting File in the Import Nautical Chart Data pop-up box, the *.000 file is still selected . You can view the updated * .001 to *.999 files.
Related topics
View Feature Object Properties