


Instructions for use
Collection Object is a type of object used to describe the relationship between objects in a chart. It expresses the relationship between each other by referring to other object objects, and does not have its own Spatial Info. Therefore, the Collection Object contains only Attributes. In the SuperMap chart, the Collection Object is stored in a pure attribute table, each Collection Object corresponds to a record, and the association between the Collection Object and the reference object is also stored in the attribute table.
Aggregation refers to an association or aggregation relationship established between objects. Through this relationship, the logical and functional relationship between different objects can be expressed more intuitively. According to the S-57 Electronic Chart product specification, Collection Object mainly includes "Collection Feature Object" (C _ AGGR) and "Association Feature Object" (C _ ASSO), where Collection Feature Object is used to represent the aggregation relationship of objects. Associative feature objects are used to describe the relationship between objects. It should be noted that Collection Objects only allow the expression of equivalence relationships and cannot create "context feature objects" (C _ STAC).
The purpose of constructing Collection Object is to organize and manage object data more effectively, and to express complex relationships between objects. For example, in a chart:
- Aggregate Feature Object: used to aggregate multiple objects into a higher-level object. For example, multiple lanes and boundary objects are combined into a traffic belt, or multiple piers with the same name are combined into a whole pier.
- Association Feature Object: It is used to describe the association relationship between objects. For example, the marker relationship of a buoy to a sunken ship.
Operation steps
- In Chart Data editing mode, open the Editable Chart Group.
- Chart tab-> Relationship Management group-> Click the Aggregation button, and the Aggregation panel will pop up on the right side of the interface. The panel is divided into two parts, the upper part for Collection Object and the lower part for Reference Object.
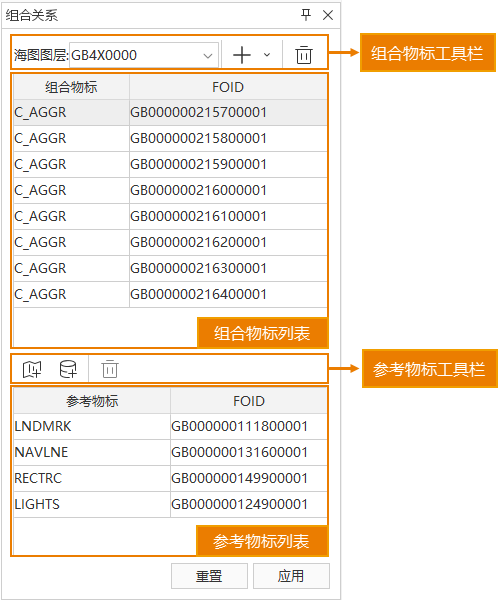
- Add combination relationship:
- collection object mark: From the Add combination relationship Drop-down Button in the Collection Object toolbar, Select collection object mark (C _ AGGR) to create a Tabular Dataset for storing collection object mark objects.
- Related Objects: Also in the Collection Object toolbar, select Related Objects (C _ ASSO) to create a Tabular Dataset of related objects.
- Add Reference Object:
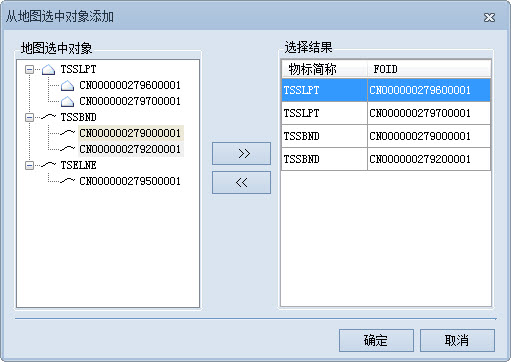
- Add the selected objects from map: select the object to create Aggregation in the chart, and click the Add Reference Objects from Map button on the toolbar. On the popup Add the selected objects from map dialog, select the desired objects to add to the Select Result list.
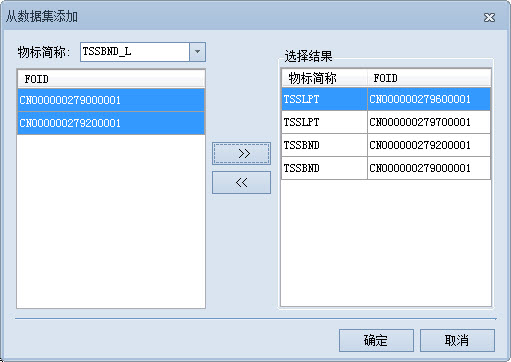
- Add from dataset: Click the Dataset Add Reference Object button on the toolbar, On the popup Add from dataset dialog, select an object from the feature object Dataset and add it to the Select Result list.
- Add the selected objects from map: select the object to create Aggregation in the chart, and click the Add Reference Objects from Map button on the toolbar. On the popup Add the selected objects from map dialog, select the desired objects to add to the Select Result list.
- Confirm Aggregation: Click the Apply button to complete the creation of Aggregation, and a "Collection" Tabular Dataset will be generated under Chart Group.
Related topics
Build Master-slave Relationships in Batches