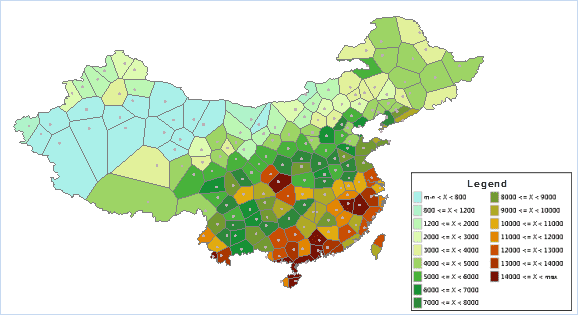
This application creates Thiessen polygons for meteorological stations in
China and then creates a Ranges Thematic map to show the ranges of average
precipitation for each polygon area.
Here are the steps:
- in the current workspace, open the sample datasource China400.udb, and create a new datasource. Name it, e.g. Thiessen.
- Import the Excel datasheet with all the national meteorological station data and import it to the Thiessen datasource. Convert the imported tabular dataset to a point dataset.
- Create a new map window and add Provinces_R to the map window. Enable the layer to be editable. Select all the region features and group them into one using the Group function in the Object Operations tab.
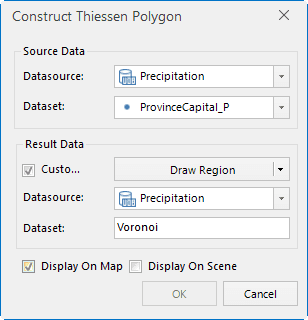
- Click Spatial Analysis->Vector Analysis-> Proximity Analysis -> Thiessen Polygon, and open the dialog box.
- In the dialog box, select the station dataset as the source dataset, and specify the region in Provinces_R as the extent for analysis.
- Check the Display on Map option and show the result polygons in the current map window.
- Create a Ranges Thematic map for the Thiessen polygons. Use the annual precipitation field as the thematic field, and set the number of ranges to 15. The result map is shown below:

