


The Properties panel for image datasets contains three modules: Dataset, Coordinate System, and Image Information. Below are detailed descriptions of each module:
Dataset
Click Dataset in the Properties panel to view attributes of the selected image dataset.
Basic Info
- Name: Displays the name of the dataset.
- File Path: Shows the storage path of the image dataset. Displayed when opening local image files directly.
- File Size: Shows the size of image files. Displayed when opening local image files directly.
- Type: Displays the dataset type.
- Table Name: Only valid for vector datasets, remains empty here.
- Encoding: Displays the compression encode type used for dataset storage.
Dataset Bounds
Top and Bottom in dataset bounds represent the maximum and minimum values along the Y-axis, while Left and Right represent the minimum and maximum values along the X-axis. Units correspond to the dataset's coordinate system.
 Note:
Note:If the original image lacks bounds, Right and Top values represent the dataset's column count (resolution) and row count respectively.
Dataset Description
Allows viewing and editing dataset metadata descriptions to help users quickly understand data content, sources, and applications.
Coordinate System
Click Coordinate System in the Properties panel to display dataset coordinate system information.
- Coordinate System: Displays the dataset's coordinate system.
- Geographic Unit: Shows the unit of the coordinate system.
- Coordinate System Details: Provides detailed description of the coordinate system.
For coordinate system toolbar functions, refer to Map Properties - Coordinate System.
Image
Click Image in the Properties panel to display image properties of the dataset.
Image Information
- Number of Bands: Displays the number of bands in a multi-band image dataset.
- X Resolution: Shows the resolution along the X-axis of the image dataset.
- Y Resolution: Shows the resolution along the Y-axis of the image dataset.
- Raster Tile Size: Displays the tile size of the current image dataset. For example, 256*256 means 256*256 pixels will be stored as a raster tile and processed as a single unit during data processing.
- NoData Value: Represents meaningless values in image data using RGB decimal integers. Can be reset after adding dataset to map. NoData expression in layer properties relates to color mode - e.g., RGB mode NoData value 96555 displays as (1,21,43) in layer properties.
Note:For read-only image files, modified NoData values won't affect histogram calculations and statistical data processing.
- Rows: Displays the number of rows in the pixel array.
- Columns: Displays the number of columns in the pixel array.
Image Metadata
Available when opening original remote sensing image files with RPC information in *.xml, *.txt, *.tif or *.tiff formats. If the original image has already been opened in *. xml or *. txt format, this grouping information can still be obtained when switching to *. tif or *. tiff format later.
- Sensor Name: Displays the sensor name used for image acquisition, e.g., GF-2, SuperView-1.
- Product Name: Shows the unique identifier for the image file during acquisition.
- Acquisition Date: Displays the image capture date, e.g., 2017-10-21.
- Cloud Cover (%): Shows percentage of cloud coverage. 0% means clear, 100% means fully covered.
- Solar Azimuth (°): Displays the angle between geographic meridian and ground projection of sun-center point connection at acquisition.
- Solar Elevation (°): Shows the angle between horizontal plane and sun direction at image center point during acquisition.
- Sensor Azimuth (°): Displays the angle between geographic meridian and ground projection of sensor-center point connection at acquisition.
- Sensor Elevation (°): Shows the angle between horizontal plane and sensor direction at image center point during acquisition.
Band Info
- Index: Displays the index (0-based) of currently displayed band in multi-band datasets.
- Name: Shows band names in the image dataset.
- Pixel Format: Indicates storage bit-depth per pixel (bits per pixel).
- Min: Minimum pixel value in the corresponding band.
- Max: Maximum pixel value in the corresponding band.
- Radiance Gain: Conversion coefficient from sensor DN values to radiance. Visible when opening RPC-equipped raw images in *.xml, *.txt, *.tif or *.tiff formats. If the original image has already been opened in *. xml or *. txt format, this grouping information can still be obtained when switching to *. tif or *. tiff format later.
- Radiance Bias: Offset value for DN-to-radiance conversion. Visible when opening RPC-equipped raw images in *.xml, *.txt, *.tif or *.tiff formats. If the original image has already been opened in *. xml or *. txt format, this grouping information can still be obtained when switching to *. tif or *. tiff format later.
- Solar Irradiance: Displays solar radiation energy per unit area/time reaching Earth's surface after atmospheric interactions (Unit: W/m²). Visible when opening RPC-equipped raw images in *.xml, *.txt, *.tif or *.tiff formats. If the original image has already been opened in *. xml or *. txt format, this grouping information can still be obtained when switching to *. tif or *. tiff format later.
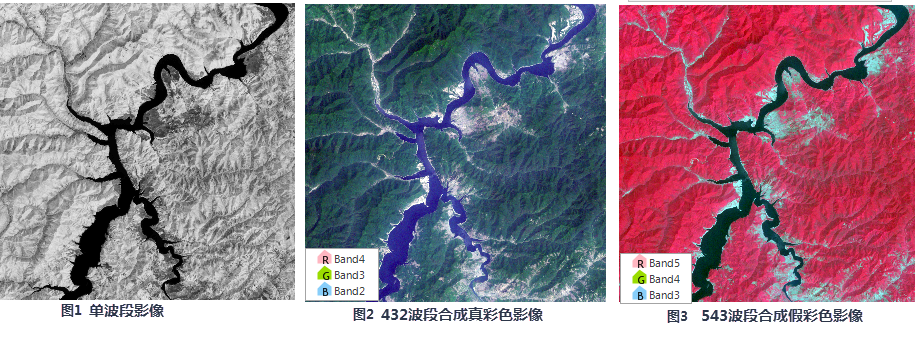
For single-band images, users can combine bands to create multi-band displays. Example: Combine single-band Landsat 8 image files for enhanced visualization.
- Add Band: Click Add to include datasets in Select dialog.
- Band 432 Combination creates true-color images for land type identification, producing results as shown in Figure 2.
- Band 543 Combination creates standard false-color composites for vegetation classification and water body detection, producing results as shown in Figure 3.
- Delete Band: Select a band in the list and click Delete to remove it.
 |
Statistics Information
Image browsing uses statistics information for layer stretching. Without statistics, images display using default stretch methods (no stretching for 8-bit data).
Calculated statistics display band pixel information. Uncalculated data shows "Current data has no statistics information". Use the Statistics button to compute statistics.
Others
- Pyramid: Indicates whether pyramids have been built for the dataset.
- Histogram: Shows if raster dataset has histogram. Use Browse to view existing histograms or Create to generate new ones.
- Visible Bounds: Sets dataset's visible extent in maps. Click Settings to select region dataset bounds as visible extent through Set Visible Bounds dialog.
Related Topics
Vector Dataset Attribute Panel
Raster Dataset Attribute Panel