A data model is an abstract description of the real world. Using these models, the real world can be modeled into computers for operations such as display, query, editing, and analysis.
Four Integrations of Data Models
- Integration of raster data and vector data
Due to differences in data structures between raster data and vector data, most GIS software often stores, manages, and displays vector data and raster data separately. SuperMap GIS adopts composite document technology and database technology to store raster data and vector data in the same data source, enabling integrated management, display, and analysis of vector data and raster data.
- Integration of object-oriented and topology-oriented approaches
Early GIS software stored spatial data using a "node-arc-polygon" (topology-oriented) data structure. With the development of object-oriented concepts, GIS software began to favor object-oriented data structures for storing spatial data, but this resulted in the loss of topology between spatial objects. SuperMap SDX+ innovatively stores object-oriented point, line, polygon, and text models alongside topology-oriented network data models in the same data source and provides mutual conversion between them for selection based on practical applications.
- Integration of GIS and CAD
Traditional GIS typically sets map display styles through layer styles and thematic maps, with each data layer containing only a single object type, such as line layers having only line objects or polygon layers having only polygon objects. It also lacks parametric spatial objects like arcs or rounded rectangles. CAD software, for the convenience of engineering drafting, widely uses parametric geometries and allows storing different types of objects in a single layer. The traditional GIS approach facilitates spatial analysis and computation, while the CAD approach favors cartographic representation, reduces storage space, and improves drawing accuracy for large-scale features. SuperMap SDX+ combines the strengths of both: in the same data source, it can store single-type objects using point, line, polygon, and text data models, or store multiple types of geometries (including parametric objects) via composite data models, with each object carrying its own display style. Through SuperMap SDX+'s composite data model, CAD data such as AutoCAD's DXF/DWG and MicroStation's DGN can be directly accessed while preserving original data attributes and styles. Custom properties can also be easily added, perfectly enabling the transition from CAD software to modern GIS software.
In SuperMap SDX+, the concept of a compound (GeoCompound) is introduced. It can aggregate various types of geometries and even other compounds, allowing the drawing and management of arbitrarily complex objects while effectively supporting AutoCAD's Block and MicroStation's Cell.
- Integration of different storage media
Early GIS software typically used files to store spatial data. With the advancement of database technology, medium-to-large GIS engineering applications increasingly adopted spatial databases. In recent years, the development of server-side technologies and the emergence of SOA have led to the growing use of OGC-standard web services (WFS, WMS, WCS, TMS, and WMTS). SuperMap SDX+ can simultaneously manage and edit data from these different sources (file databases, database data sources, and web data sources). In SuperMap maps, data from different sources can coexist and be uniformly saved in a workspace.
Model Selection Application Examples
When simulating the real world, different data models are selected for description based on the research context. For example, rivers are important elements in human society and the natural world. Humans use rivers for transportation or as administrative boundaries, while animals often use rivers as habitats or habitat boundaries. In GIS, rivers can be modeled differently for various application scenarios, as follows:
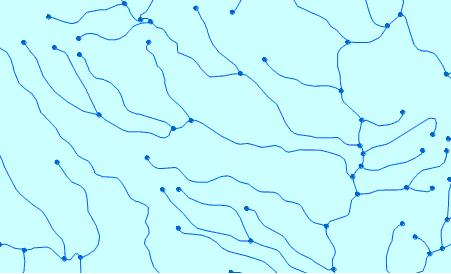
- In urban water network studies, rivers as line features composing the network require description using the network data model (Network). Each line has attributes such as length, flow direction, and capacity. In real life, facility network analysis within network analysis can be used to find river sources, identify common upstream or downstream sections of several tributaries, or trace pollution sources from contaminated areas.
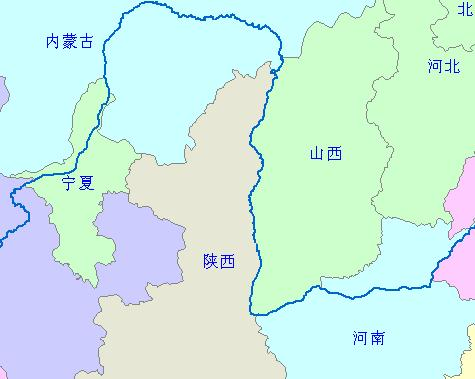
- When analysis focuses only on river length and direction without considering area or width, rivers can be described using the line data model. For example, the Yellow River serves as an administrative boundary between Shaanxi and Shanxi, as shown.
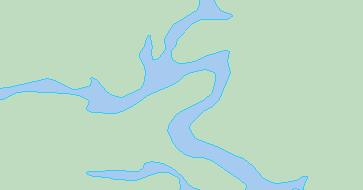
- At large scales, rivers are generally expressed using the polygon data model, with attributes such as width, depth, and load capacity. For instance, studying bridge construction over a river requires considering its width, while analyzing river islands involves considering its area.
The river example illustrates that even simple elements like rivers can be described by multiple data models. Therefore, when abstracting the real world, the best universal data model does not exist. The choice of data model should depend on the specific application scenario and the problem to be solved. Different models are selected to simulate the real world based on different problems.
Data Model Types
Point Data Model
Point Data Model (Point): A point is a zero-dimensional shape stored as a single pair of x, y coordinates with attribute values. It expresses geographic features that are too small to be described as lines or polygons at a certain scale.
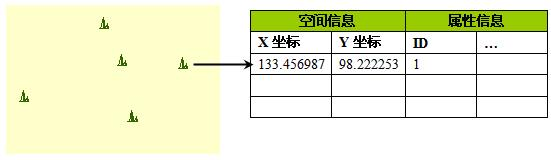
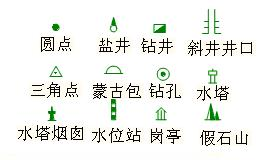
All objects have size and shape, but the point data model primarily expresses an object's spatial position information without concerning itself with its shape or size. For example, if we only want to know the location of the Himalayas, it is described using the point data model on a world map. SuperMap GIS provides different symbols to represent points with various meanings.
Line Data Model
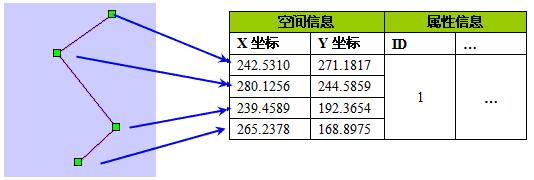
Line Data Model (Line): A line is a one-dimensional shape stored as a series of ordered x, y coordinate pairs with attribute values. The line data model allows for complex line objects. Line shapes can include straight lines, polylines, circles, ellipses, or spirals, with circles, ellipses, and arcs being stored as polylines. The line data model expresses linear geographic features that cannot be described as polygons at a certain scale. When only one-dimensional information like direction or length is considered, without width or area, the line data model is used, such as for rivers serving as provincial boundaries or city roads at small scales.
The difference between simple geometry and complex geometry: Simple geometry is typically a single object, while complex objects consist of multiple simple objects or are generated after spatial operations. For example, when drawing the Yellow River basin, many simple line segments represent the main stream and tributaries. To view the main stream and tributaries as a whole, they are merged into a complex line object representing the entire basin.
Polygon Data Model
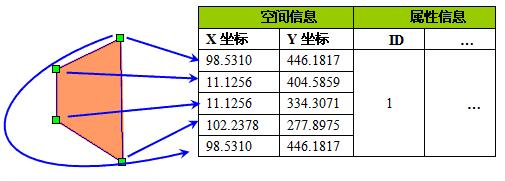
Polygon Data Model (Region): A polygon is a two-dimensional shape stored as a series of ordered x, y coordinate pairs with attribute values, where the last point's x, y coordinates must match the first point's. It describes a closed geographic feature with a certain area, surrounded by a series of line segments. For example, provinces in administrative maps are represented using the polygon data model, or rivers at large scales are also expressed this way.
The polygon data model includes complex polygon objects, which are essential for describing geographic features. For instance, the entire Shanghai area consists of four polygons: Shanghai city, Chongming Island, Changxing Island, and Hengsha Island. Since these four form a whole, they cannot be correctly described with simple objects and require complex polygon objects.
Multipoint Data Model
Multipoint Dataset (MultiPoint): Used to represent a collection of multiple discrete, topologically unrelated point coordinates, such as meteorological stations, sensor networks, or POI clusters. It facilitates batch management, analysis, and visualization of densely distributed point data, improving storage and computational efficiency.
This dataset is supported starting from the SuperMap iDesktopX 2025 version.
Tabular Dataset Model
Tabular Dataset (Tabular): A tabular dataset stores and manages collections of attribute table data. It contains no spatial graphic data, meaning it cannot be added as a layer to the map window for display. Attribute table data describes terrain and feature characteristics, such as river length and width. Socioeconomic data and statistical data can also serve as attribute table information.
Text Model
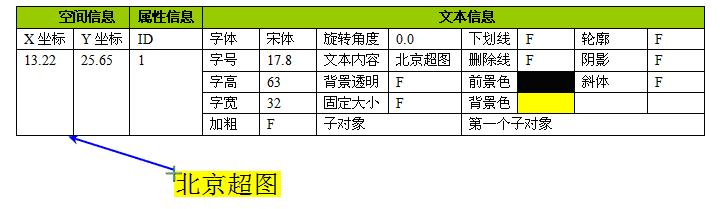
Text (TEXT): Stored in two parts. The first part is a pair of x, y coordinates with attribute values (called the text anchor point, i.e., the top-left corner of the text's minimum bounds). The second part includes text properties such as content, font, font size, height, width, boldness, rotation angle, font color, transparent background, fixed size, etc., as shown below.
Regarding text's transparent background and fixed size: Transparent background—selected for text (to be added) to have a transparent background; otherwise, the background color from settings is shown, defaulting to transparent. Fixed size—text size does not scale with layer zoom. If text represents map information that needs scaling with the map, fixed size is not used. If text indicates scale-independent information like place names, fixed size is applied. When setting fixed size, the font height cannot exceed 255 logical units (0.1mm each). If exceeded, the system automatically sets fixed size to 255.
Text is mostly used for map labeling or auxiliary descriptions. For map labeling, a text layer composed of text objects can be used directly, or a label thematic map can be employed.
Label content in a label thematic map can be built from field expressions, representing various forms like fractions or combinations of multiple field contents, and can include properties like no overlap and flow. Text style is uniform across a label thematic map layer. In contrast, each text in a text dataset can have its own display style.
In summary, using a label thematic map for labeling is generally more flexible and easier to adjust. When fixed positions, individual display styles, or data import/export are needed, a text dataset can be chosen. SuperMap GIS provides the "Save as Text Dataset" function for label thematic maps, allowing users to create a label thematic map first, then save it as a text dataset, and finally adjust specific texts as needed.
CAD Dataset
CAD Dataset: Refers to a data model that can store multiple types of geometries, as shown below. CAD data features aesthetic graphics and small storage space. Early GIS engineering applications often used CAD software (e.g., AutoCAD, MicroStation) for mapping, contributing significantly to map digitization in the early stages of GIS development. However, CAD data lacks easy attribute expansion and GIS analysis capabilities.
With the advancement of GIS applications, transitioning from CAD software to GIS software is inevitable. This requires importing CAD data into GIS software or even enabling GIS software to directly read and edit CAD data. SuperMap GIS introduced the composite data model specifically for storing and managing data structures similar to CAD or spatial data for CAD-like purposes. Through SuperMap GIS's composite data model, CAD data including AutoCAD's DXF/DWG and MicroStation's DGN can be directly accessed while preserving original data attributes and styles, and custom properties can be easily added.
Data formats supported by CAD Dataset:
CAD can store different types of geometries like points, lines, polygons, and text, as well as various parameterized objects. All objects can have their own styles.
Differences between CAD Dataset and simple data models (point, line, polygon data models) are as follows:
- CAD Dataset can store multiple types of data, such as points, lines, polygons, and text, while simple datasets can only store one type, e.g., point datasets store only points, not lines or polygons.
- Different objects in a CAD dataset can have different styles, whereas all objects in a simple dataset share the same style, requiring uniform layer style settings or thematic maps based on attributes for differentiation.
- In a CAD dataset, several objects can be combined to form a compound. After combination, the compound's attribute record is added to the end of the attribute table, with system fields assigned by the system and non-system fields retaining the corresponding attribute values from the object with the smallest SMID value. Source objects and their attribute records are deleted. Compounds can combine with other compounds or simple objects to form new compounds. For example, in landscape planning and design drawings, many symbols composed of points, lines, polygons, and text are used. Combining these into a complex object facilitates drawing. As shown, the disability symbol combines a circular polygon, an arc, and several polylines into a compound, allowing it to be moved and pasted as a whole.