


Similar to graduated color thematic map and graduated symbol thematic map, the dot density thematic map also classifies selected fields of vector layers into different levels. Each level is represented by point symbols displayed in density patterns, where the density distribution within regions proportionally corresponds to attribute values. Higher attribute values result in denser point symbol distribution on the map, and vice versa. Notably, the dot density thematic map is SuperMap's exclusive thematic map type that only supports polygon layers, and cannot be created with other layer types. It is commonly used for visualizing quantitative characteristics such as regional grain production, GDP, population distribution, etc.
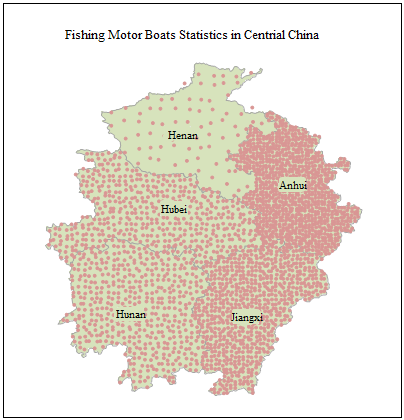
Click the Dot Density Thematic Map button in the Thematic Map tab to generate a default-styled map. Users can also customize dot density maps through parameter settings in the Dot Density Thematic Map dialog. The following illustration demonstrates a dot density thematic map based on 2003 fishing motorboat power statistics of five central provinces, using a base value of ten thousand kilowatts. The density variations clearly indicate provincial power levels: Anhui Province has the highest motorboat power, followed by Jiangxi Province, while Hubei and Hunan Provinces show comparable values, and Henan Province has the lowest.
 |
The dot density thematic map can be created from any polygon vector layer. To begin, set the target polygon layer as current in the Layer Manager.
Two Approaches to Create Dot Density Thematic Maps:
 Create a Dot Density Thematic Map
Modify Dot Density Thematic Maps