


To generate vector tiles, first prepare an effective vector map. SuperMap supports generating vector tiles from point, line, polygon, and text layers. Most symbolization and layer settings in SuperMap can be supported by MapBox styles. However, due to differences in style representation between MapBox and SuperMap, there are some limitations in vector map production. This document details key cartographic considerations through standard map production workflows:
8. Display Differences Between Tiles and Original Maps
Data Coordinate System
When creating maps, if the data coordinate system differs from the map display coordinate system, dynamic projection can enable correct display. However, for vector tile generation, we recommend converting data to the map's display coordinate system first. The reason: Vector tiles use the map's display coordinate system. Different coordinate systems will trigger on-the-fly conversion during tile generation, which consumes significant disk space and processing time for large datasets, affecting efficiency.
Reduce Data Complexity
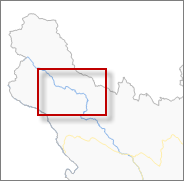
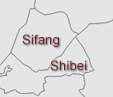
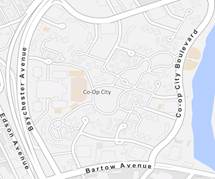
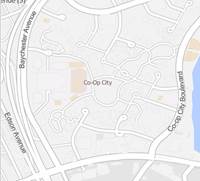
During vector tile generation, dense geometries undergo node simplification to improve performance. While usually visually negligible, exceptions exist. For example: Using polygon rivers at small scales (left image below) with complex nodes may result in distorted shapes after simplification (right image). We recommend using line features for rivers at small scales and splitting complex geometries with excessive sub-features to improve processing speed.
 |
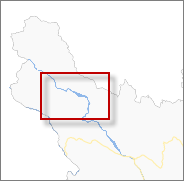 |
| Figure: Line symbol display effects in original map (left) vs vector tile (right) | |
Symbolize Maps
MapBox supports most point symbols, common line symbols (e.g., roads), and basic fill patterns. Avoid complex symbols that may render incorrectly. Replace unsupported symbols using alternatives below:
Unsupported point/line symbols and alternatives:
|
Symbol Type |
SuperMap Symbol |
Vector Tile Display |
Alternative Solution |
|
Point |
|
|
Create new point symbol using square geometry. |
|
Line |
|
|
Create line symbol with short dash sublines and adjust virtual-real mode. |

Unsupported polygon symbols and alternatives:
|
Symbol Type |
SuperMap Symbol |
Vector Tile Display |
Alternative Solution |
|
Polygon |
|
|
Convert fill patterns to images, then create fill symbols using image fills. |
 Notes:
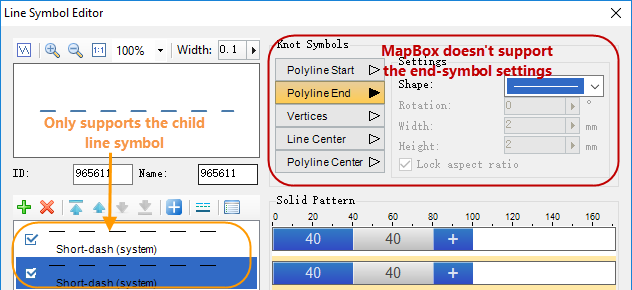 |
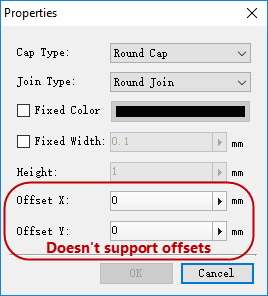 |
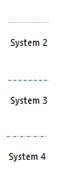
| Figure: Sublines supported by MapBox | Figure: Sublines properties dialog |
- Vector tiles do not support scale with map.
- Custom line symbols only support "default" sublines. Offset and end symbols are unsupported.
- Fill symbols can only contain one image or pattern sublayer.
Text Effects
MapBox has limitations in text effects support:
|
Text Effect |
Original Map |
Vector Tile |
Supported |
|
Bold Outline |
|
|
√ |
|
Bold Italic |
|
|
√ |
|
Shadow |
|
|
× |

 Notes:
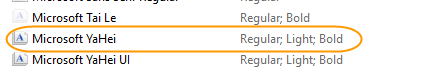 |
- Use fixed text sizes for vector tile generation
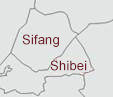
- Vector tiles use the first text style in each text layer
- Ensure font variants (bold/italic) are installed for proper rendering
Create Thematic Maps
MapBox supports limited thematic map types:
 |
| Figure: Thematic map support in MapBox |
Notes:- Offset settings in thematic maps unsupported
- Label expressions using SQL functions unsupported
- Maximum one thematic map and one label map per dataset
- Only two text placement directions supported along lines
Set Visible Scale Range
Set visible scale ranges for layers to optimize vector tile rendering performance. Use global scales for reference.
Layer Display Filters
Vector tiles support basic filter expressions:
- Comparison operators: =, >, <, != (e.g., GDP_2014 > 10000)
- Logical operators: AND, OR, NOT (e.g., POP_2014>4000 AND GDP_2014>15039.38)
Notes:- Do not include table names in field references
- Only numeric comparisons supported
Display Differences Between Tiles and Original Maps
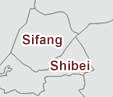
- Text Layout: Different line break handling between MapBox and SuperMap
Original Map
Vector Tile


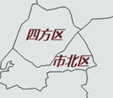
- Label Alongline: Different label placement algorithms
Original Map
Vector Tile
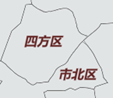
- Overlap Settings: MapBox handles feature overlaps differently
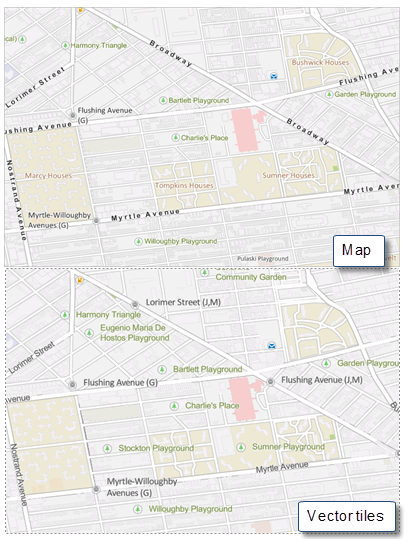
Figure: Unsupported overlap settings in vector tiles
Related Topics