


Drawing Diagrams
Instructions for use
A diagram is a graphical and visual representation of numbers and tables, which intuitively displays relationships, distributions, trends, and patterns in data. SuperMap iDesktopX supports inserting saved diagrams from the current workspace into the layout as images, enriching the data information in the layout and presenting data in a diversified manner.
Function Entry
- Layout->Features->Objects->Diagram button.
Operation Instructions
- In the layout, draw the insertion range for the diagram.
- In the pop-up dialog, select the diagram to fill into the specified range. The drop-down options list all saved diagrams in the current workspace. Click the OK button to insert the specified diagram into the layout as an image.
- After selecting the image, you can move its position in the layout, and adjust its height and width. Alternatively, double-click the image object, and in the Layout Object Properties panel that pops up on the left, set the size and position of the image in the Geo tab.
- The resulting image after insertion is as follows:
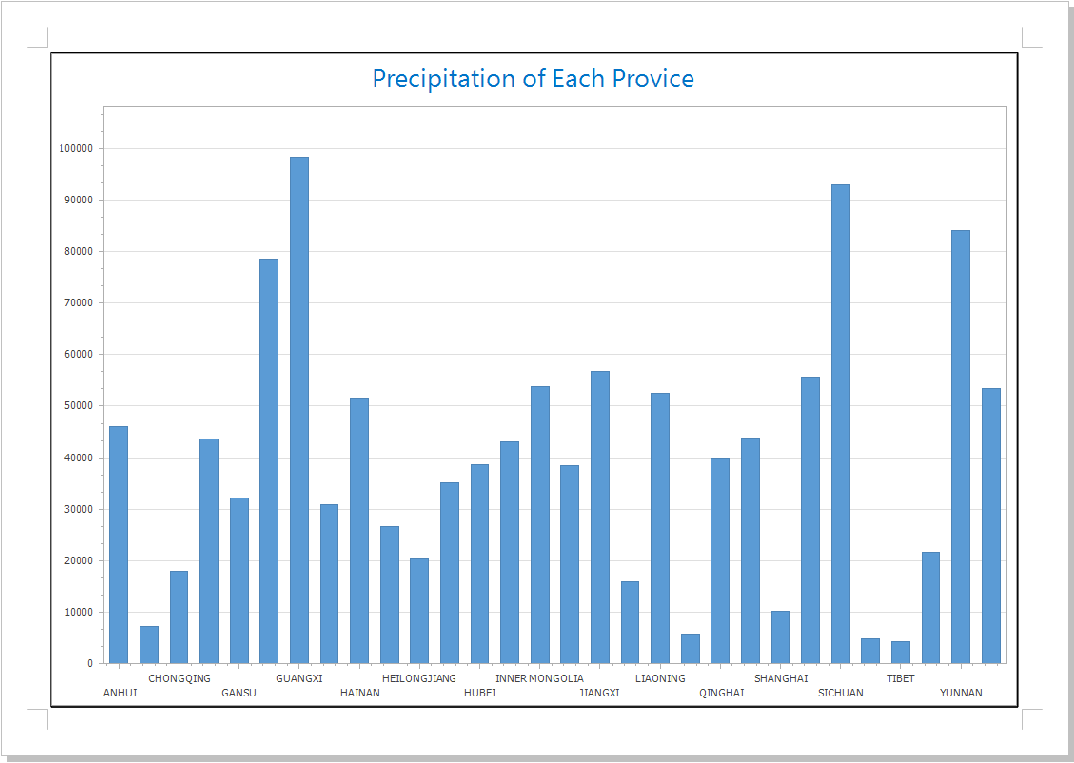
Figure: Inserting Diagram into Layout
Related Content