


Feature Description
A topology diagram is a schematic representation generated from network datasets that illustrates logical structures, presenting complex networks in an intuitive manner to simplify their visualization.
It finds applications in resource management across telecommunications, transportation, pipeline, and power industries. By examining networks through topology diagrams, users can effectively evaluate existing resource distributions and forecast future resource allocations.
SuperMap supports constructing topology diagrams based on network arcs and nodes, facilitating network connectivity checks and logical diagram acquisition. Three layout types are available: Tree Diagram, Hierarchy Diagram, and Orthogonal Diagram.
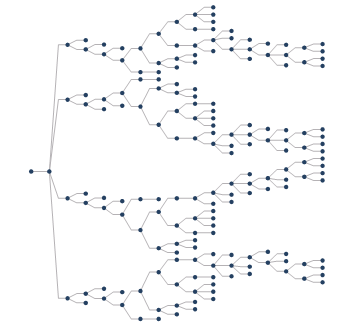
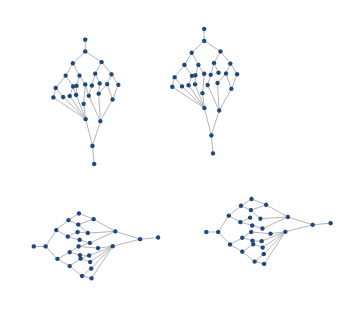
- Both Tree and Hierarchy Diagrams suit directional facility networks with explicit sources. As shown in Figure 1, networks with single sources (one entry point per subnet) can generate these diagrams, as demonstrated in Figures 2 and 3.
- For Tree Diagrams, each subnet supports either single-source or single-sink configurations. Figure 2 illustrates a single-source scenario with unrestricted sinks, while the reverse configuration is also supported.
- Compared to Tree Diagrams, Hierarchy Diagrams offer more compact layouts. Tree Diagrams have limitations - Figure 4 shows subnets that cannot form tree topologies due to multi-source configurations. However, Hierarchy Diagrams handle this effectively, as shown in Figure 5.
- Orthogonal Diagrams require fewer data constraints. The algorithm orthogonally arranges node and link elements by hierarchy, prohibiting self-looping arcs (where start and end nodes coincide).

Figure 6: Orthogonal Diagram
 |
 |
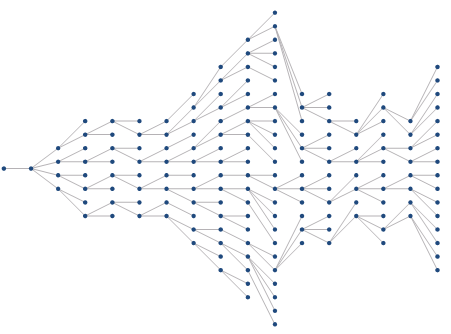 |
| Figure 1: Original Network Dataset | Figure 2: Tree Diagram | Figure 3: Hierarchy Diagram |
 |
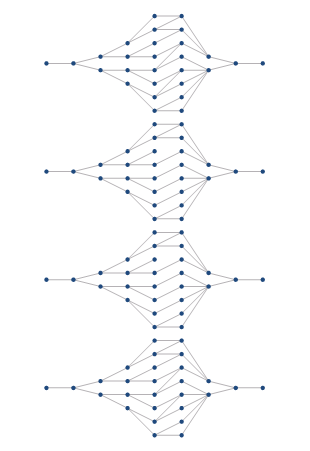 |
| Figure 4: Original Network Dataset | Figure 5: Hierarchy Diagram |
Feature Entry
- Data Tab->Topology->Topology Diagram->Tree Diagram/Hierarchy Diagram/Orthogonal Diagram.
Parameter Description
Tree Diagram
- Layout Direction: Defines diagram orientation with four options:
- From Left to Right: Diagram starts from left root node
- From Right to Left: Diagram starts from right root node
- From Top to Bottom: Diagram starts from top root node
- From Bottom to Top: Diagram starts from bottom root node
- Level Distance: Sets vertical spacing between tree levels (default: 50). As shown in Figure 7, dx represents level distance between nodes ① and ②.
- Break Ratio: Determines polyline break position (default: 50% midpoint). Figure 7 shows how 70% break ratio affects connection between nodes ① and ②.
- Node Distance: Controls horizontal node spacing (default: 10). dy in Figure 7 shows inter-node distance.
 |
| Figure 7: Parameter Illustration |
Hierarchy Diagram
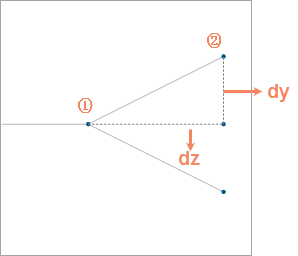
- Hierarchy Distance: Sets vertical spacing between hierarchy levels (default: 20). dz in Figure 8 shows level distance between nodes ① and ②.
- Smoothness: Controls line smoothing (values >1 enable smoothing, default:1).
 |
| Figure 8: Parameter Illustration |