


Feature Description
Vegetation plays a vital role in global ecosystems. Using remote sensing imagery to obtain vegetation information has become an important approach for studying climate and ecological changes. NDVI data is closely related to numerous vegetation parameters and serves as a crucial indicator for monitoring vegetation changes on the ground.
- NDVI (Normalized Difference Vegetation Index) separates vegetation from water and soil, objectively reflecting changes in vegetation coverage. It is considered the best indicator for vegetation growth status and coverage density.
- NDVI is derived from reflectance values of near-infrared band and red band in imagery. The formula is: NDVI=(NIR-R)/(NIR+R), where NIR represents near-infrared band reflectance and R represents red band reflectance.
- NDVI results are constrained between [-1,1]:
- Negative values indicate ground cover such as clouds, water, or snow with high visible light reflectance;
- 0 represents rocks or bare soil where NIR and R are approximately equal;
- Positive values indicate vegetation coverage, increasing with higher coverage density;
Data Description
Vegetation and water indices can be calculated using various satellite remote sensing data. Currently, NDVI/NDWI calculations based on satellite remote sensing imagery such as TM, SPOT/VEGETATION, and MODIS are widely used in vegetation dynamic monitoring, land use/cover change detection, crop/pasture yield estimation, and drought monitoring across various scales. Users should understand remote sensing data types and band definitions before processing. Below are common satellite data bands for NDVI/NDWI calculation:
- For TM satellite images (7 bands): Band2=green band, Band3=red band, Band4=near-infrared band. NDVI=(Band4-Band3)/(Band4+Band3), NDWI=(Band2-Band4)/(Band2+Band4).
- For SPOT-5 satellite images: Band1=near-infrared, Band2=red band, Band3=green band. NDVI=(Band1-Band2)/(Band1+Band2), NDWI=(Band3-Band1)/(Band3+Band1).
- For Landsat 8 satellite images (OLI sensor with 9 bands): Band3=green band, Band4=red band, Band5=near-infrared band. NDVI=(Band5-Band4)/(Band5+Band4), NDWI=(Band3-Band5)/(Band3+Band5).
Feature Entry
- Data Tab -> Data Processing -> Raster -> NDVI.
- Toolbox -> Data Processing -> Raster -> NDVI.
Parameter Description
- Red Band: Sets the red band involved in calculation. Select red band dataset for single-band imagery, or specify red band in multi-band dataset.
- Near Infrared Band: Sets the near-infrared band involved in calculation. Select near-infrared band dataset for single-band imagery, or specify near-infrared band in multi-band dataset.
- Result Data: Specifies output datasource and dataset. The system will generate a raster dataset based on NDVI formula using selected red and near-infrared bands.
Application Example
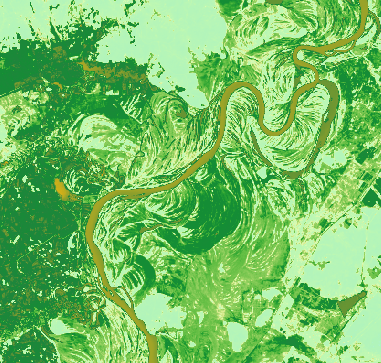
Using Landsat 8 image data from June 2013 and June 2018 in a specific region, NDVI indices were calculated to compare vegetation coverage changes. The results show denser vegetation coverage in 2013 compared to 2018, indicating reduced vegetation coverage in 2018.
 |
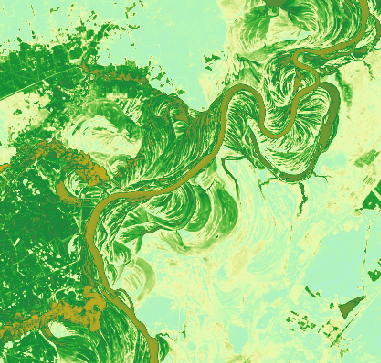 |
| 2013 NDVI Result | 2018 NDVI Result |
Related Topics