


Feature Description
The summary function is used to calculate statistical data for fields in the attribute table. The summary count will output a new attribute table, consisting of fields containing statistical results and the frequency of each single value in the summary.
It supports setting multiple summaries for simultaneous multi-type statistical summarization, making statistics more convenient and efficient. The count is attribute table data, facilitating users to export to Excel or other file formats for use in other scenarios. For example, when performing land use data summarization, users need to count various data such as slope, quality grade, cultivated land, and construction land. Using the summary function avoids repeated statistical condition setups and quickly obtains the count.
Function Entrance
- Table tab->Statistics group->Summary button
Parameter Description
- Source Dataset: Set the data participating in summary statistics by configuring filter expression and group field.
- Filter Expression: Filter out data that does not need to participate in statistics by setting filter expression. For how to use SQL Expression, please refer to SQL Expression.
- Group Field: Supports setting grouped statistics. If no group field is specified, the output attribute table will contain only one record. If one group field is specified, each group field value will have a corresponding record. If multiple group fields are specified, secondary grouping will occur based on the previous grouping.
- Summary: In the summary list, check the fields to participate in summarization and set the statistics type.
- Select Statistic Field: In the field list, each field has a checkbox; checking it indicates the field participates in statistics.
- Statistics Type: Supports the following statistical operations: maximum, minimum, sum, average, standard deviation, and variance, with multiple selections supported. Here, set statistics type to maximum, minimum, and sum.
- The following naming convention creates corresponding result fields for each statistics type: Max_‘field’, Min_‘field’, Sum_‘field’, Average_‘field’, StdDeviation_‘field’, Variance_‘field’, where ‘field’ is the input field for calculating statistics.
- Target Dataset: Set the data source and dataset to store the summary count output.
Application Example
Case Description
Existing land use classification data for a certain area includes fields such as Administrative Division Name (XZQHMC), Land Type Name (DLMC), and Land Parcel Area (TBDLMJ). It is necessary to statistically summarize the area of different land parcels in each administrative division. Taking sample dataSampleData\ExerciseData\LandUse\LandUse.udbx as an example, detail the summary operation.
Main Operation Steps
- Open the LandUse.udbx data source, select the vector dataset JSTB, and choose Browse Attribute Table from the context menu.
- Click the Summary button in the Table tab->Statistics group; or right-click and select Summary Field..., which pops up the Summary dialog box.
- Set two group fields XZQHMC (Administrative Division Name) and DLMC (Land Type Name) in the group field section. The program will first group by XZQHMC, then perform secondary grouping by DLMC based on the initial grouping.
- Check the checkbox for the TBDLMJ (Land Parcel Area) field in the summary list. Set its statistics type to Max, Min, and Sum.
- Set the data source and dataset to store the summary count output.
- Click the OK button to execute the field summary operation. The execution completed will provide a result prompt in the output window. The summary results will generate a new tabular dataset.
Show Result
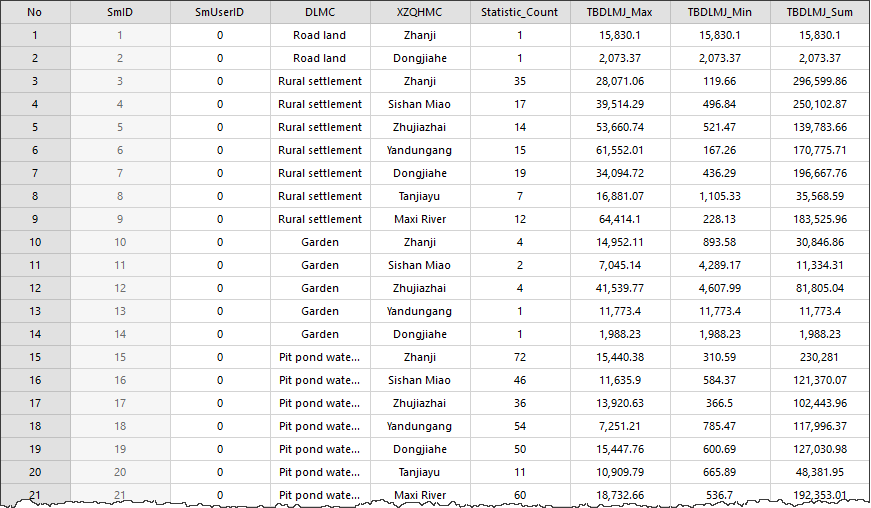
Administrative Division Name and Land Type Name are the set group fields. Statistic_Count is the frequency of each single value of the statistic field under the current group field. Max_TBDLMJ, Min_TBDLMJ, and Sum_TBDLMJ are the results of the statistics types.
Related Topics