


Feature Description
The statistics function in the attribute table is used for quick statistical analysis and visual display of fields in the attribute table. You can perform one-click statistics on data from a single field, multiple fields, or a selected region. The system will automatically calculate various statistical metrics and generate corresponding diagrams (histograms or bar charts) based on type, allowing you to intuitively view the distribution patterns of the data. This function is suitable for work requiring statistics on large amounts of data, such as reviewing results from data migration and conducting quality checks on production data, and can effectively help you quickly understand data characteristics.
| Statistical Analysis Type | Description |
| Sum | Used to calculate the sum of the attribute values for the selected field(s) in the attribute table. |
| Average | Used to calculate the average of the attribute values for the selected field(s) in the attribute table. |
| Maximum | Used to find the maximum attribute value among the selected field(s) in the attribute table. |
| Minimum | Used to find the minimum attribute value among the selected field(s) in the attribute table. |
| Variance | Used to calculate the variance of all attribute values for the selected field(s) in the attribute table. |
| Standard Deviation | Used to calculate the standard deviation of all attribute values for the selected field(s) in the attribute table. |
| Count | Used to count the total number of single values present in the selected cells of the current tabular. |
Field types that support statistics include numeric, text, and date. Different field types support different statistical analysis types, as detailed below:
- Numeric fields support all seven statistical analysis types mentioned above;
- Text fields only support the Count statistic;
- Date fields support statistics for Maximum, Minimum, and Count.
Functional Entrance
- Tabular->Select one column, multiple columns, or an area -> Context menu ->Statistics
-
Table tab->Statistics group->Statistics button
Operational Steps
- Open the attribute table, select one column, multiple columns, or an area within the attribute table.
- Click Statistics in the context menu, or click the Statistics button in the Statistics group on the ribbon. The Statistics dialog box will appear.
- In the statistics information table on the left side of the dialog box, you can view the count of the selected data. You can use the tool buttons above the table to perform the following operations:
- Add a Field: Click theAdd button to check the fields you want to analyze in the pop-up field selector.
- Select All: Used to select all records in the list box.
- Select Reverse: Used to invert the selection of records in the list box, meaning records that were not selected become selected, and previously selected records become deselected.
- Save as a property sheet: ClickSave as a property sheet to open the Save as a property sheet dialog box, where you can save the statistics information table as a tabular dataset.
- Datasource/Dataset: Set the target datasource and dataset name for saving the tabular dataset.
- Only selected records saved: Used to set whether only the selected rows are saved as a tabular dataset. If checked, only the currently selected rows are saved; if unchecked, all records in the table are saved.
- Copy: Click the Copy button to copy the selected records from the table to the clipboard as formatted text (e.g., Field Name: XXX, Sum: XXX).
- Delete: Click the Delete button to remove the selected records from the table.
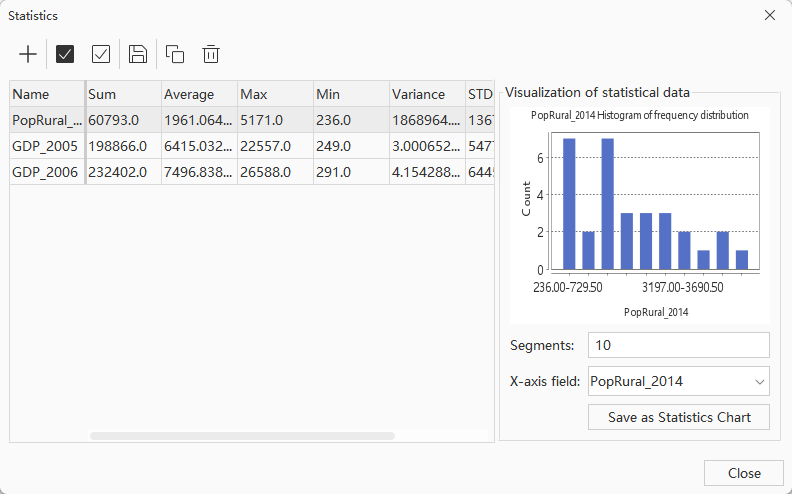
- The area on the right side of the dialog box is the visualization of statistical data area. Here you can view the corresponding diagram (histogram or bar chart) generated based on the type.
- Histogram: When a numeric field is selected in the left list, a corresponding histogram will be generated to view the data distribution.
- Classes: Used to control the number of segments in the histogram. The default value is 10, and the valid range is positive integers.
- X-axis Field: Allows switching to display histograms for other numeric fields; only currently added numeric fields are available.
- Bar Chart: When a text field is selected on the left, a corresponding bar chart will be generated to view the count of each single value.
- Group Field: Allows switching to display bar charts for other text fields; only currently added text fields are available.
- Save as Statistics Chart: Click theSave as Statistics Chart button to save the currently displayed chart as an independent chart under the Diagram node in the Workspace Manager.
- Histogram: When a numeric field is selected in the left list, a corresponding histogram will be generated to view the data distribution.
 Tip:
Tip:Each time the statistics dialog box is opened, the statistics information will be updated based on the latest values of the fields in the attribute table.
Related Topics