


Raster Statistics
Feature Description
The Raster Statistics feature is used to calculate and analyze the grid values within a raster dataset. This feature helps users view the specific single-value distribution of raster data.
 Caution:
 This feature is only applicable to raster datasets (Grid data). It cannot be used for image datasets (e.g., raster data in Image format). Therefore, the Raster Statistics option is not available in the context menu for such datasets.
This function is similar to the Histogram feature. Both analyze grid values in a grid dataset; however, they differ in their output:
- Histogram: Displays the frequency distribution and data of a specific field grouped into intervals.
- Raster Statistics: Counts the unique grid values and the number of occurrences for each specific value in the dataset.
Feature Entry
- Workspace Manager -> Raster Dataset node context menu -> Raster Statistics
Steps
- Right-click on a grid dataset node (or select multiple dataset nodes) in the Workspace Manager.
- From the context menu, select Raster Statistics. The system will calculate the grid values for the selected grid dataset(s).
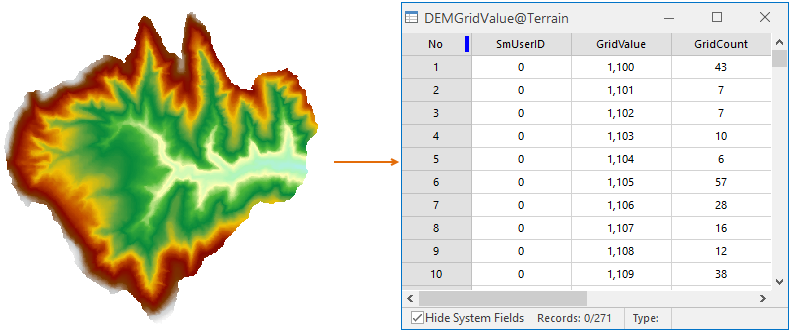
- Upon successful calculation, the results will automatically appear in the form of an attribute table. The table records the unique grid values and their corresponding counts, as shown in the image below.
Related topics
Recalculate Extent/Length/Perimeter and Area