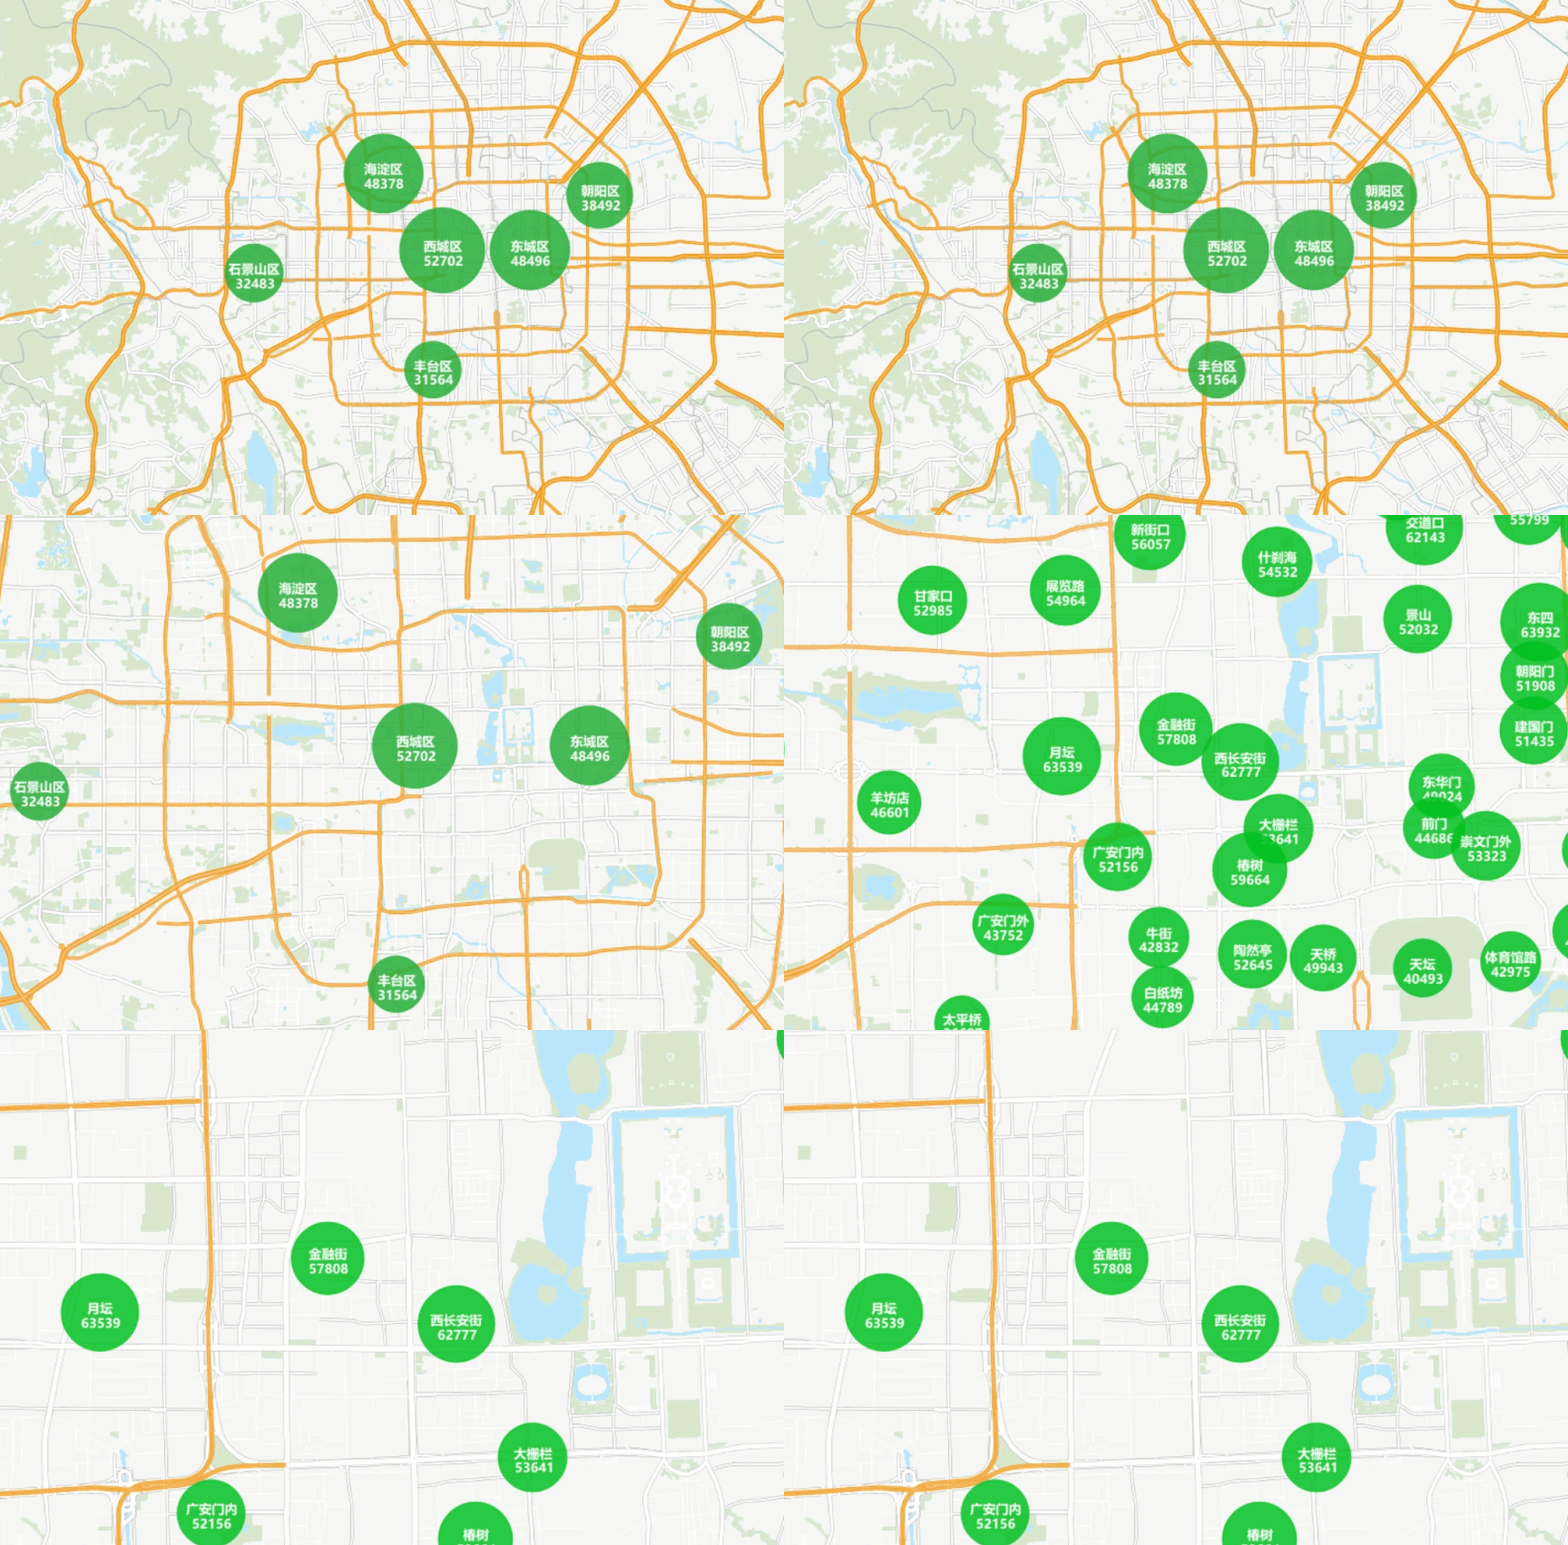
Application Example of Regional Aggregation Map
Case Description
Using Beijing second-hand housing prices as an example, this case demonstrates how to visualize price distribution through regional aggregation map with aggregated marker sizes and labels, providing consumers with intuitive housing price information.
Data Description
- Beijing second-hand housing data containing district, street, and community information for aggregation mapping.
- Beijing administrative division data for basemap creation.
- Chengdu transportation data for basemap visualization of traffic networks.
- Chengdu land use data including residential areas, rivers, parks, etc.
- The sample data package contains the aforementioned data information but requires separate download. Details can be found in Obtaining Sample Data Package.
Key Steps
- Open SampleMap\AnalyticalMap\RegionalCluster\Beijing.smwu and add the Room_P dataset to Beijing basemap.
- Select Room_P layer in Layer Manager. Click Thematic Map tab -> Aggregation Map group -> Dynamic Aggregation Map button to create aggregation map with default parameters.
- In Layer Properties panel, set Group Field to Room_P.county.
- Configure Aggregate Field as price.
- Select Average as aggregation method (options include: Average, Count, Maximum, Minimum, Sum).
- Set text style in Label Settings. Customize font (e.g., Microsoft YaHei), size, italic angle, color, outline, shadow, and font effects (Bold, Strikethrough, Italic, Underline, Shadow, Transparent Background, Outline). Enable Bold effect here.
- Define Label Expression as: "county || '\n' || avg(price) || '\n' || 'CNY/m²'".
- Set display precision (default: 0).
- Adjust label line spacing (default: 0mm).
- Customize marker symbols in Symbol Selector (default symbols retained here).
- Set minimum/maximum marker sizes to 40/60 respectively.
- Configure color scheme with max/min opacity values (5 and 20 in this case).
- Set maximum minimum visible scale for aggregation layer. As labels remain static across scales, create separate aggregation layers for different scale ranges. Set visible scales to 1:72,224 and 1:288,896.
- Repeat Step 2, then set Group Field to Room_P.town in Layer Properties.
- Repeat Steps 4-6, updating Label Expression to: "town || '\n' || avg(price) || '\n' || 'CNY/m²'".
- Repeat Steps 8-11, setting visible scales to 1:9,028 and 1:72,224.
Result Display


