


Feature Description
Simply put, a Grid Map is a spatial data presentation method that uses spatial polymerization to illustrate the distribution and statistical characteristics of spatial data. Its basic principle relies on a grid aggregation algorithm, which divides a spatial area into regular-shaped grid cells. Each grid cell is further subdivided into multiple levels, where higher-level cells are divided into several lower-level cells, each containing statistics infomation.
SuperMap supports constructing a grid aggregation map from spatial point data and provides two grid shapes for aggregation display: rectangular grids and hexagonal meshes. The map points are divided using the grid, and then the number of point features within each grid cell is calculated as the statistical value for that grid. Alternatively, weight information from the points can be introduced, considering the weighted value of points within the grid cell as the statistical value. Finally, based on the statistical value of each grid cell, and sorted by the magnitude of these values, the grid cells are filled with colors using a color ramp.
A complete grid aggregation map consists of the following elements:
- Grid: Each grid cell is a uniformly sized lattice, which can be quadrilateral or hexagonal. The size of the grid cell remains fixed regardless of changes in map scale. The grid is used to count point records that fall within each grid cell.
- Label: Each grid center has a label, which is the statistical value of the grid cell. This statistical value can be the count of point records within each grid cell or the weighted value of points within each grid cell.
- Grid Rendering Style: The fill color of the grid cells indicates the distribution trend of the grid statistical values. Colors range from dark to light, representing grid cell values from large to small. Additionally, the style of the grid rectangular border can be set.
Function Entry
Select the point data layer for which you want to create a Grid Map in the layer manager:
- In the Thematic Map tab -> Aggregation Map group -> Click the Grid Map button.
- Right-click and select Create Thematic Map ... from the context menu. In the pop-up Create Thematic Map dialog, choose Aggregation Map -> Grid Map.
Operational Steps
- A Grid Map thematic layer will be generated in the layer manager.
- Select the Grid Map layer, right-click and choose the Modify Thematic Map command. The current Grid Map settings are displayed in the pop-up Layer Properties panel.
- The display effects of the Grid Map can be adjusted through some set parameters, including display control for the Grid Map layer and general properties settings such as change dataset.
- Display Control: Set the layer visibility, layer name, layer caption, transparency, and maximum/minimum visible scale respectively.
- Visibility: In the layer properties panel, you can uniformly set the visibility of all layers within a layer group. If the Visible checkbox is checked, then all layers under the selected layer group are visible; if the Visible checkbox is unchecked, then all layers under the selected layer group are invisible.
- Layer Name: Used to display the name of the selected layer group. The layer group name cannot be modified; it serves as the unique identifier for this layer group within the map where the group resides.
- Layer Caption: The text box on the right displays the title of the selected layer group. You can modify the layer group title. After modification, the display name of this layer group in the layer manager changes, but the layer group's name does not change accordingly.
- Transparency:: The number adjustment box and drop-down button on the right can set the transparency level of the current layer. Users can directly input the transparency value or click the drop-down button to the right of the label and use the slider to adjust transparency, previewing the results in real-time. The default transparency value is 0, meaning the layer is completely opaque. As the value increases, the layer becomes more transparent; when the transparency value is set to 100, the layer is completely transparent. The transparency value range is an integer between 0 and 100.
- Minimum Visible Scale: The combo box is used to set the minimum visible scale for all layers within the layer group. After setting the minimum visible scale for the layer group, if the map scale is smaller than the set minimum visible scale, all layers within the layer group will be invisible. You can enter a scale value in the number adjustment box to the right of Minimum Visible Scale, such as 1:500000, or set the current map scale as the minimum visible scale. You can also click the drop-down button on the right to select a scale setting as the minimum visible scale. The default dropdown options are 8 scales from 1:5000 to 1:1000000; if the map has fixed scales set, the dropdown options will be those fixed scales.
- Maximum Visible Scale: The combo box is used to set the maximum visible scale for all layers within the layer group. After setting the maximum visible scale for the layer group, if the map scale is larger than the set maximum visible scale, all layers within the layer group will be invisible. You can enter a scale value in the number adjustment box to the right of Maximum Visible Scale, such as 1:500000, or set the current map scale as the maximum visible scale. You can also click the drop-down button on the right to select a scale setting as the maximum visible scale. The default dropdown options are 8 scales from 1:5000 to 1:1000000; if the map has fixed scales set, the dropdown options will be those fixed scales.
- Change Dataset: Click the drop-down arrows to the right of Datasource and Dataset respectively to select the dataset to reference and the data source where that dataset resides. For more information, please refer to: Change Dataset.
- Display Control: Set the layer visibility, layer name, layer caption, transparency, and maximum/minimum visible scale respectively.
- Parameters: Settings for the Grid Map layer such as grid field, grid type, color scheme, border style, etc., can be configured.
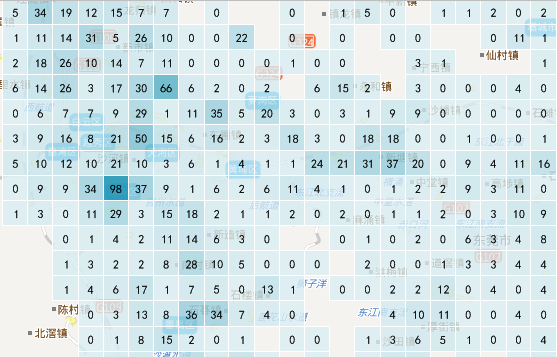
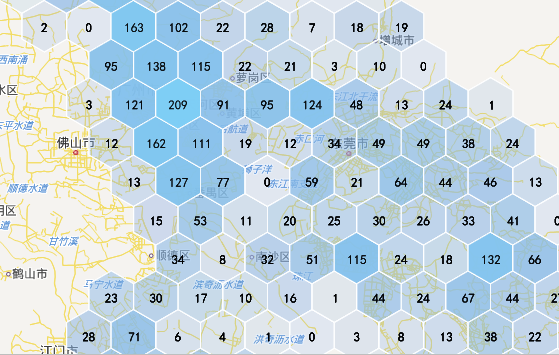
Figure: Quadrilateral Grid Figure: Hexagonal Grid - Grid Field: The grid field can be left unspecified. In this case, the default statistical value for each grid cell in the Grid Map is the count of point records falling within that cell. If a grid field is specified, its value will be used as the weight information for the points. Then, the statistical value for each grid cell is the weighted value of the points falling within that cell. Fields in the dropdown list default to displaying Field Alias. If needed, you can switch to field names in the File tab -> Options group. For details, refer to the Preference Settings document. The specified grid field must be a numeric field.
- Display Precision: Supports setting the display precision for grid statistical values. This is particularly useful for adjusting the aesthetics of labels on the map when the grid field is of double precision type. For example: if the grid value is 178.3129 and the display precision is set to 0.1, the grid value displayed on the map will be 178.3; if the display precision is set to 0.001, the grid value displayed will be 178.312.
- Aggregate: When a grid field is specified, you can specify the aggregation method for the points in that field. The application provides five aggregate methods: Average, Count, Maximum, Minimum, and Sum.
- Grid Type: SuperMap provides two grid shapes for aggregation display: quadrilateral mesh and hexagonal mesh. Choose the appropriate grid type based on mapping needs.
- Side Length: This property sets the grid side length, measured in pixels.
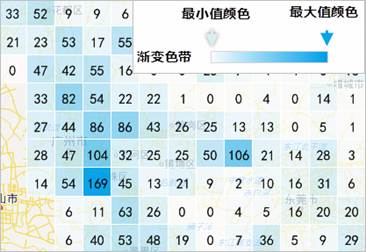
- Set Color Ramp: The color scheme combo box dropdown lists the color schemes provided by the system. Selecting the desired color scheme will cause the system to automatically allocate thematic styles corresponding to each rendering field value based on the chosen color scheme.
- Minimum Color Transparency is used to render the transparency level of the grid cell with the smallest statistical value in the Grid Map.
- Maximum Color Transparency is used to render the transparency level of the grid cell with the largest statistical value in the Grid Map.
- Vertex Color: Supports user selection of the displayed vertex color, offering two types: HSB and RGB.
- Original Point Visible Scale: Sets the visible scale range for the point dataset layer that generates the Grid Map. Click the combo box drop-down button; the application provides 10 scale types: 1:5000, 1:10000, 1:25000, 1:50000, 1:100000, 1:250000, 1:500000, 1:1000000, Current Scale, and System Default Scale. Users can also input a custom scale. This facilitates setting the visible scale range for original points according to mapping requirements.
- System Default Scale: The application calculates a scale based on the current Grid Map to serve as the visible scale for original points. Original points are invisible at scales smaller than the system scale and visible at scales larger than the system scale.
- Set to Current Scale: Sets the current map scale as the visible scale range for the point dataset layer. Original points are invisible at scales smaller than the current scale and visible at scales larger than the current scale.
- Grid Label: The grid label for a grid aggregation map mainly includes the following aspects:
- Show Labels: If this checkbox is checked, the grid aggregation value labels are visible within the grids. If unchecked, they are invisible. Click the button to the right of the text box to set the label style for the displayed grid aggregation values, including font, color, font effect, etc. Modifying label text size is not supported here.
- Border Style: You can set the border style of the grid, configuring the line style of the grid cell's rectangular border. There are three options: No Border, Solid Border, Dashed Border; set the border line width; set the border line color, and support semi-transparent effect settings.
- Through the above parameters, the creation of a Grid Map based on a point dataset is complete.
Application Example
Grid Maps use spatial polymerization methods to represent the distribution and statistical characteristics of spatial data. Compared to heat maps, they have the advantage of quantifying the distribution of geographic features. The figure below shows a Grid Map created from point data of scenic spots in Zhejiang Province, reflecting the distribution of tourist attractions across the province's cities.
Data Path SuperMap sample data SampleData->AggregationMap->GridAggregationMap
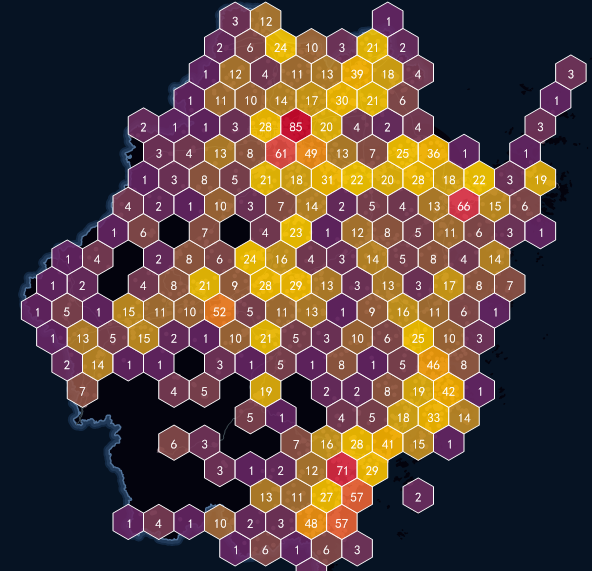 |
| Figure: Grid Map of Tourist Attraction Distribution in Zhejiang Province |