Dynamic Aggregation Map Application Example
Case Description
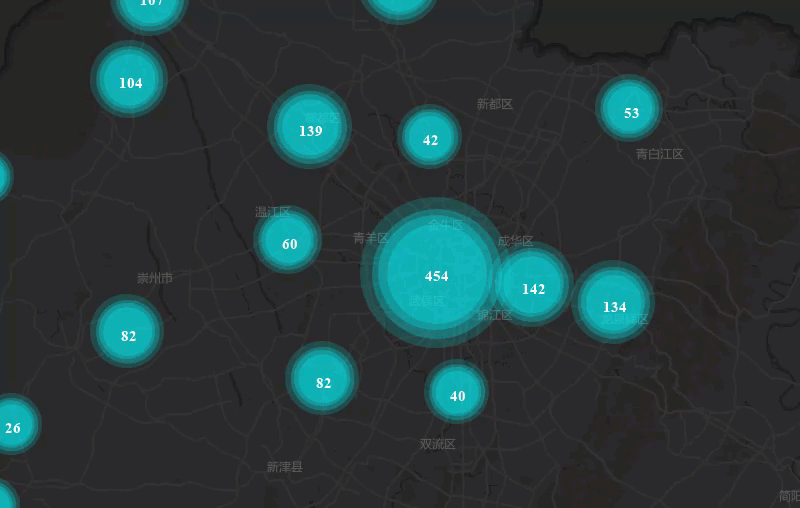
Taking Chengdu's educational resource distribution as an example, this case demonstrates the application of dynamic aggregation map to visualize resource distribution through cluster counts and marker sizes, providing data references for rational resource allocation and school district housing selection.Data Description
- Chengdu educational resource POI data for creating aggregation maps.
- Chengdu administrative division data containing district/county information for base map creation.
- Chengdu transportation data used for base map creation to display traffic capacity.
- Chengdu land use data including housing, rivers, parks, etc.
Notes:
|
Main Steps
- Open sample dataSampleMap\AnalyticalMap\DynamicClustering\DynamicClustering.smwu, and add dataset Education_P to the preconfigured Chengdu base map (if using the map from workspace directly, remove existing dynamic aggregation map layers);
- Select Education_P layer in layer manager, click Thematic Map Tab -> Aggregation Group -> Dynamic Aggregation Map button to create aggregation map with default parameters;
- In the Layer Properties panel, set aggregation radius to 20. Larger radius results in fewer clusters;
- Set aggregation field when necessary (must be numerical type). No setting required when only displaying point clustering. Leave unset here;
- Configure label precision. After setting aggregation radius and aggregate method, decimal points may appear. Use display precision to control decimal places. Keep default setting: 0;
- Configure aggregate method. After setting aggregation radius, select resampling method from: Average, Count, Maximum, Minimum, Sum. No setting required here;
- Customize label style including font, size, italic angle, text color, outline color, shadow color, and font effects (bold, strikethrough, italic, underline, shadow, transparent background, outline and outline pixel size). Set font to Microsoft Yahei with bold effect;
- Configure marker style for aggregation symbols. Select symbol type through marker symbol selector, and set maximum/minimum marker sizes to 40 and 15 respectively.
Result Display