


Basic Statistics
Feature Description
Calculates basic statistical information for each pixel based on input raster data, while allowing intuitive viewing of statistical results and grayscale information through histograms. Statistics include: maximum value, minimum value, mean value, standard deviation, and variance.
Feature Entry
- Spatial Analysis Tab->Raster Analysis group->Raster Statistics->Basic Statistics.
- Toolbox->Raster Analysis->Raster Statistics->Basic Statistics.
Parameter Description
- Source Dataset: Select raster data for statistical analysis, including the datasource and dataset where the data resides.
- Statistics Result: Displays basic statistical content after execution, including maximum value, minimum value, mean value, standard deviation, etc.
- Max: Finds the maximum value in raster pixel values.
- Min: Finds the minimum value in raster pixel values.
- Average: Calculates the mean value of all pixel values in raster data.
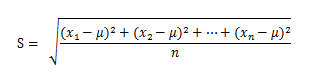
- STDEV: Computes the standard deviation of all pixel values. Standard deviation measures the average dispersion from the mean, reflecting data discreteness. It's the square root of variance. Given sample data x1,x2,x3,......xn with mean µ, the formula is:
- Variance: Calculates the variance of all pixel values. Variance represents the average of squared differences from the mean.
- Histogram: Displays the histogram of current raster data. For details, see Raster Histogram.