


The application provides histogram functionality to visualize the distribution of sampling points. Click the Histogram button in the Raster Analysis group under the Spatial Analysis Tab to view the histogram of sampled data.
A histogram, also known as frequency distribution histogram, displays grouped frequency distribution of a specified field from sampling data along with statistical data summaries. The area of each bar represents the relative frequency within specific intervals. Equal-width classification is used by default. The following figure shows frequency distribution (15 classes) of a dataset field:
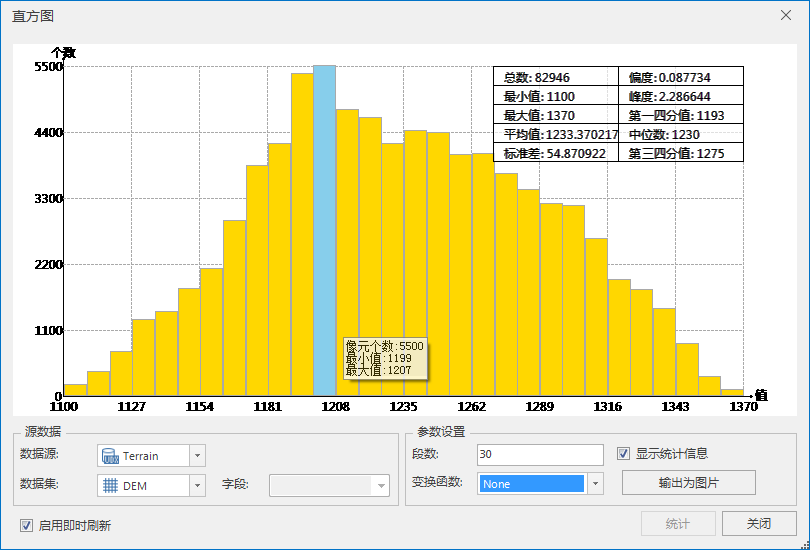 |
| Figure: Sampling Point Histogram |
Histograms help examine data distribution patterns. Statistical summaries reveal positional distribution, shape, and dispersion. For instance, comparing mean and median values identifies distribution center. When these values closely align, the data approximates normal distribution.
 Histogram Dialog Description
The upper chart area displays histograms and statistical information, while the lower section configures data parameters.
Chart Area
The X-axis represents sample values, and Y-axis shows frequency counts. Top-right statistics panel displays 10 metrics: total count, minimum, maximum, mean, standard deviation, kurtosis, first quartile, median, and third quartile.
Source Dataset
Datasources: Lists all datasources in current workspace. Select the datasource containing target point dataset.
Dataset: Lists all point datasets in source datasource. Select analysis dataset.
Parameter Settings
Classes: Enter positive integer to specify histogram bin count.
Transformation Function: Three transformation options for field values:
- None: Use original data without transformation.
- Log: Natural logarithm transformation for positive-skewed data. Ensure data >0 before application.
- Arcsin: Arcsine transformation for proportional/percentage data. Requires data range [-1,1].
Show statistics: Check to display statistical summary. Uncheck to hide.
Statistics Information
- Total Count: Total objects in point dataset.
- Min/Max/Mean/Std. Dev: Minimum/maximum/mean/standard deviation of statistical results.
- Skewness: Measures distribution symmetry. 0=symmetric; positive=left-skewed (mean>median); negative=right-skewed (mean
- Kurtosis: Indicates outlier likelihood. 3=normal; >3=peaked; <3=flat.
- First/Third Quartile: 25th and 75th percentile values in sorted data.
- Median: 50th percentile value. For even counts, uses first middle value.
Export as Image: Export histogram as image (supported formats: BMP, EMF, EPS, JPG, PNG, TIF).
 Notes
Notes
Hovering/selecting histogram bars displays real-time information: object count and min/max values for selected range.
- Object Count: Number of points in selected bar.
- Min/Max: Minimum/maximum values of selected statistics.