


 Feature Description
Euclidean distance represents an idealized measurement that often fails to meet practical requirements. For instance, while the Euclidean distances from point B and point C to the nearest source A may be identical, actual time costs may differ significantly if route BA experiences traffic congestion while route CA remains clear. Moreover, paths calculated by Euclidean distance often prove impractical when encountering obstacles like rivers or mountains, requiring detours that necessitate cost distance calculations.
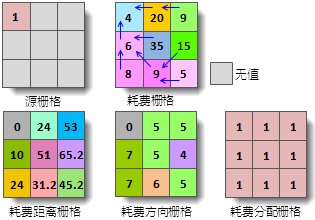
Cost distance quantifies the actual expenditure (e.g., time or monetary cost) required to reach the nearest source through weighted attributes of each cell. The Generate Cost Distance Raster function produces three outputs: Cost Distance Raster, Cost Direction Raster, and Cost Allocation Raster, based on source datasets and cost raster inputs.
Cost Distance Raster: Represents the minimum cumulative cost for each cell to reach the nearest source, with cell values indicating the total cost. The nearest source refers to the one with the lowest cumulative cost. Cells with NoData in the cost raster will remain NoData in the output.
The cost calculation method involves multiplying the distance traveled through each cell along the least-cost path from the target cell center to the nearest source by the corresponding cell value in the cost raster, then summing these values. Thus, cost distance depends on cell size and cost raster values. In the schematic diagram below, both source and cost rasters have a cell size of 2. The red line illustrates the least-cost path from cell (2,1) to source (0,0):
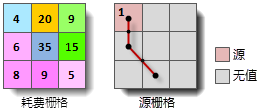
The minimum cost (cost distance) for cell (2,1) to reach the source is calculated as:

Cost Direction Raster: Indicates the travel direction along the least-cost path from each cell to the nearest source. Eight possible directions (N, S, W, E, NW, SW, SE, NE) are encoded using integers 1-8 as shown below. Source cells receive value 0, while NoData cells in the cost raster are assigned value 15.

Cost Allocation Raster: Identifies the nearest source for each cell. Cell values correspond to the source's grid value (for raster sources) or SMID (for vector sources). NoData cells in the cost raster remain NoData in the output.
Feature Entry
- Spatial Analysis Tab->Raster Analysis Group->Distance Raster Drop-down Button->"Generate Distance Raster (Custom Cost)".
- Toolbox->Raster Analysis->Distance Raster->Generate Distance Raster (Custom).
Steps
- Source Data Settings: Specify the source dataset containing features of interest (e.g., wells, roads, schools). Sources can be vector or raster data.
- Cost Data Settings: Select the cost raster dataset. Negative values in the cost raster will trigger a warning: "Negative values are not allowed in cost rasters!".
The cost raster defines unit movement costs through each cell, which could represent factors like elevation or slope. For example, crossing a mountain might offer shorter Euclidean distance but higher time cost compared to detouring.
- Parameters: Configure distance grid parameters including maximum distance and resolution.
- Max Distance: Sets the maximum accumulation cost threshold (default 0: no limit). Cells exceeding this threshold receive NoData in all output rasters.
- Resolution: Defines output dataset resolution. Default uses 1/500th of the source dataset's bounding box diagonal length.
- Result Settings: Select output datasource and name for cost distance raster, cost direction raster, and cost allocation raster.
- Click "Environment Settings" to configure analysis environment parameters including geographic extent, clip bounds, and cell size. Refer to Setting Analysis Environment for details.
Note: Environment parameters can be saved as global settings for subsequent raster analysis operations. If unset here, parameters from the Raster Analysis Environment will be used.
- Click "Execute" to generate cost distance rasters.
Application Example
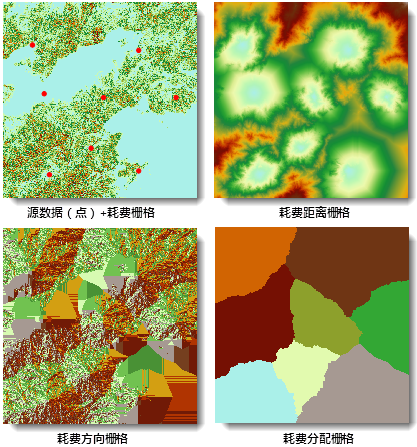
The example below demonstrates using a point dataset as source data and a reclassified slope raster as cost input. The outputs include cost distance, direction, and allocation rasters.
 Related Topics
 Generate Straight Line Distance Raster
Generate Surface Distance Raster