Select Vector Layer as the current layer in Layer Manager, and the setting options of Vector Parameters will appear in the Layer Properties interface. Function controls of Property Settings such as Complete Line, Optimize Cross, Scale Symbol, object minimum size, and display Filter are included.
Complete Line
Complete Line ensures that the line symbol of the line object is displayed completely, helping you to optimize the Display Effects of the line symbol.
If the length of the line object is less than length of the line symbol period, or if the length of the line object is less than integer multiple of the length of the line symbol period, the portion of the line that is less than length of the line symbol period is not fully displayed. Using the Complete Line command, the length of the line symbol is re-divided to calculate a length drawing that is very close to the length of the line object.
As shown in the Marker Style  of the figure, when the length of the line object is less than one cycle of the line symbol, the schematic diagram of using Complete Line and not using Complete Line is as follows:
 |
 |
| Not Complete Line | Complete Line |
Therefore, the Complete Line command is better for the Display Effects of line layers with shorter length and more broken lines, which can achieve the purpose of beautifying the map.
Optimize Cross
For line layers, it is common for multiple line objects to intersect with each other, such as water systems and roads. If it is not processed, the display according to the normal situation is not only not beautiful enough, but also may not conform to the actual situation, and the connectivity between crossed line objects can not be correctly expressed. We often need to optimize the intersecting lines, remove the overlapping parts of the "intersection" position, and finally achieve the real intersection Display Effects.
As shown in the figure below, we often need to optimize the intersecting lines, remove the overlapping parts of the "intersection" position, and finally achieve the real intersection Display Effects.
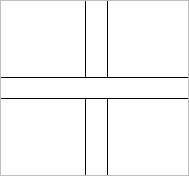 |
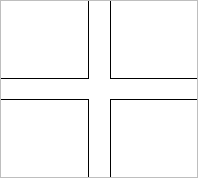 |
| Optimize Cross not used | Use Optimize Cross |
- The Optimize Cross function is available for normal line layers, Network Data line layers, and not for CAD data line layers and Route Data.
- The Optimize Cross function works only for line objects whose Layer Style is double-line type, such as
 , but not for some line type symbols, such as single-line type symbols, such as
  .
.
Enable Optimize Cross
Select the Optimize Cross check box to enable the cross function on linetype objects in the current layer. If the check box is checked, the Optimize Cross effect is applied to the linetype in the layer; otherwise, the Optimize Cross effect is not applied.
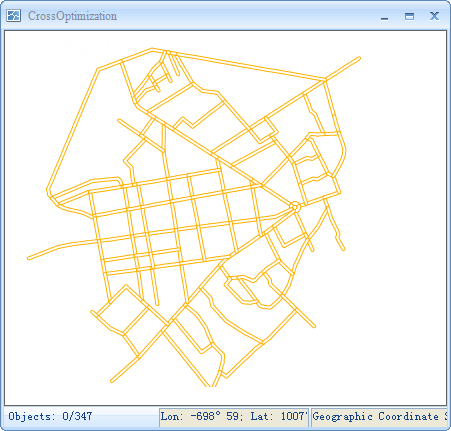 |
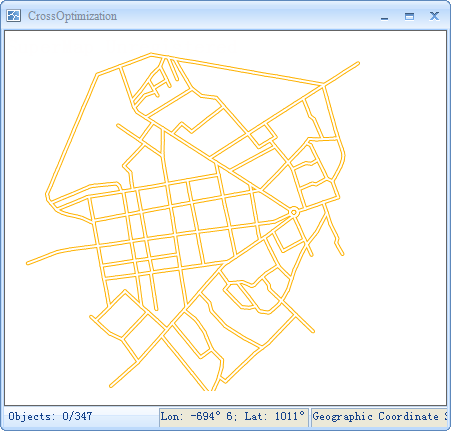 |
| Before using Optimize Cross | After using Optimize Cross |
Scale Symbol
Used to set whether the map symbol object in the layer will be zoomed in or zoomed out when the map is zoomed in or zoomed out. The Scale Symbol check box can be applied to dot symbols, line symbols, face Fill symbols, and their borders.
When the Scale Symbol check box is selected, map symbols in the current layer are scaled with the map. The scaling degree of the symbol object in the current layer is determined by the scaling reference scale and the scaled scale of the map each time the user performs a zoom-in or zoom-out operation.
Zoom base scale bar
The scaling degree of the symbol object in the current layer is determined by the scaling reference scale and the scaled scale of the map each time the user performs a zoom-in or zoom-out operation. If the scale of the Current Map is larger than zoom reference scale, the map symbol is enlarged by the same magnification scale; otherwise, the map symbol is reduced by the same reduction scale. For example, if the base scale of the symbol is 1:500000, and the size of the symbol is 30, when the Map Scale is 1:100000, that is, the map is magnified by five times, the size of the symbol is also magnified by five times, and the Marker Size becomes 150.
When the Scale Symbol check box is selected, the Scale Reference Scale combo box becomes available, and the user can click its Drop-down Button and select the Set to Current Scale option in the drop-down list to set the scale of the map in the current Map as the scale of the scale; You can also cancel the setting of the zoom reference scale by selecting the Clear option in the drop-down list. At this time, the Zoom Reference Scale combo box is empty, indicating that the symbol does not zoom with the map.
Note: When the scaling reference scale is not consistent with the current scale of the map, the Marker Size in the current Map may be changed if the symbol scaling is not checked (i.e. Scale Symbol is not enabled). At this time, the symbol display will be scaled from the scaling reference scale to the current Map Scale.
Antialiasing
Anti-aliasing: When drawing a line or polygon boundary that is not horizontal and not vertical on a raster graphics display, it can have a more or less jagged or stepped appearance. This is because straight lines, polygons, color boundaries, and the like are continuous, while a raster is composed of discrete points, and the representation of straight lines, polygons, and the like on a raster display device must be sampled at discrete positions. The information distortion caused by insufficient sampling and reconstruction is called "aliasing". The technique used to reduce or eliminate this effect is called anti-aliasing.
The Antialiasing check box is used to reduce or eliminate Layer Info distortion and optimize Layer Display Effects. Map anti-aliasing and layer anti-aliasing must be enabled at the same time for anti-aliasing to take effect. For Map anti-aliasing operations, see Map display optimization .
Show Overlap
This is used to control whether to display the objects with capping. If this check box is checked, All Objects with capping will be displayed. The layer Show Overlap effect will take effect only when the Show Overlap check box in the Map Properties panel is checked. You can also make detailed settings in Overlap Settings. For details, see Overlap Settings in Map Properties.
Object Minimum Size
The text box to the right of the Object Minimum Size (mm): tab is used to set the minimum size of the object displayed in the current layer. When Current Map is zoomed in or out, if the larger of the width and height of the minimum Bounds of any Geometry in the layer is less than minimum display size of the object set here, the Geometry is not visible. In the text box to the right of this tab, you can enter a specific value, in millimeters, to set the minimum display size of the objects in the current layer.
Rarefy Display
When there are too many nodes on the boundary line of a line object or a face object, Rarefy Display can be performed on it, and the nodes within the set tolerance pixel can be thinned by setting a threshold value, so as to improve the map display performance. Note: Rarefy Display is only supported for Line Dataset and Region Dataset.
- Tolerance (pixels): Set a tolerance value. Within the range of this value, when the number of nodes of line objects and face objects is greater than set threshold, they will be thinned. The tolerance unit is pixel, and the default tolerance value is 0.5, that is, within 0.5 pixels, if it is greater than 500 nodes set by the default threshold, the object will be Rarefy Display.
- Threshold (number): By giving a threshold, if the number of nodes is greater than threshold within the set tolerance range, the object will be thinned, otherwise, the object will not be thinned.
When Rarefy Display is performed on the Region Dataset, if the tolerance is set to be too large or the threshold is set to be too small, the places where the objects are connected in the map will be displayed as disconnected, because Rarefy Display only performs Display Control on the data in the visible range of the screen. Topology between objects is not involved.
Filter overlapping small objects
Support the setting of Filter overlapping small objects, and specify that only one object is drawn for all small objects smaller than set size in the tolerance area. Reduce the time consumed when a large number of small objects are displayed at a small scale to improve browsing performance.
Overlapping small objects: If the length and width of the Bounds of an object are both less than threshold value of overlapping small objects, the object is regarded as a small object. The overlapping small objects are in the specified unit pixel area (a square area, the side length of the square is equal to the minimum size attribute value of the object), if multiple small objects are drawn in the area (the center point of the small object Bounds is in the square area, the small Object Drawing is considered to be in the area), The small objects are considered overlapping small objects.
Filter overlapping small objects: When the small objects in the layer are displayed, the unit pixel area is drawn only once. Therefore, only one small object is displayed in the area, and other overlapping small objects are not displayed.
Filter overlapping small objects needs to set two parameters: tolerance and minimum object size. Parameter Description is as follows:
- Tolerance: This attribute is used to set the size of the unit pixel area. The Valid Range for this tolerance is Is no less than1, Is no more than10, in pixels.
- Minimum size of object: This attribute is used to set the size threshold of objects participating in filtering. The Valid Range of the object's smallest size is Is no less than1, Is no more than10, in pixels.
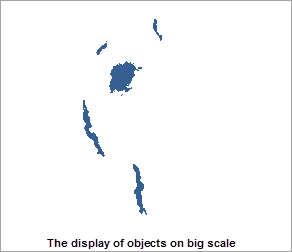
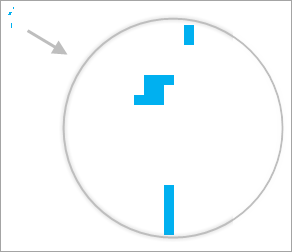
The following diagram can help you understand the function of filtering small objects. Fig. 1 shows the display of Filter overlapping small objects under large scale and small scale. Fig. 2 shows that the tolerance is set to 8 pixels. The minimum object size is 8 pixels. Filter overlapping small objects.
 |
 |
| Figure 1: Not Filter over lapping small objects. |
If the Tolerance Settings of the overlapped small object is 8 pixels, the object with the length and width of Bounds less than 8 pixels participates in the filtering; the designated unit pixel area is a square area with a side length of 8 pixels, and the starting point of the unit pixel area is the Uppe-left corner of the window point of the map. As shown in fig. 3, based on the set unit pixel area, the Map is divided into regular grids, taking the drawing of the object in the second row and second column area in the figure as an example, assuming that the object marked by the purple arrow precedes the Object Drawing marked by the red arrow, when the object pointed by the purple arrow is drawn, it is judged that the object is a small object, and the center point is located in the square area. And if no other small object is drawn in the square area, the small object is kept displayed, and meanwhile, the small object drawn in the area is marked; and when the object indicated by the red arrow is drawn, the object is also a small object, the center point is in the square area, but the area is marked with a small Object Drawing, so the object is not displayed.
See the Object Display Order Field for the default object Display Order.
 |
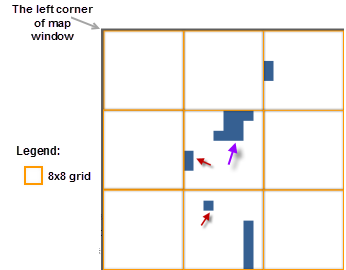 |
| Figure 2: Filter over lapping small objects with a tolerance of 8 pixels and a minimum object size of 8 pixels | Fig. 3: Process diagram of Filter over lapping small objects. |
Filter overlapping small objects can reduce the display time of a large number of small objects at a small scale. The difference between Filter overlapping small objects and filtering small objects by the minimum size of objects is that after the minimum size of display objects is set, all objects smaller than minimum size will not be displayed, which will result in that no objects can be displayed in a large area where small objects are concentrated when the map is displayed; Filter overlapping small objects can ensure that at least one small object is displayed in the unit pixel area, which avoids the problem that no object is displayed in a large area where small objects are concentrated.
Displays the Filter
The Filter Expression: space combo box is used to set the display Filter of the current layer to filter which objects in the layer can be displayed and which objects cannot be displayed, so that the user can display the features of interest and filter out the features that do not need to be displayed temporarily. Please refer to the Displays the Filter for the specific operation steps.
Object Display Order Field
The drawing order of the objects affects the Display Order of the objects on the map. The objects in the map are displayed in the order of the values in the fields you set. Support the setting of Multi-field display sorting. Click the button on the right side of the object Display Order display box to pop up the Display Order Field Settings dialog box. In this dialog box, you can add one or more sorting fields, and edit and delete the added field sequence. To add multiple fields, sort by the first field in the list box, and then sort by the second field value based on the first sorting, and so on. You can adjust the order of multiple fields by clicking Top, Bottom, Move Up, and Move Down in the lower right corner of the dialog box.
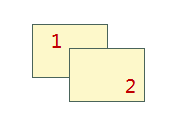
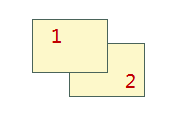
If there is no sorting field, the default Display Order of the engine is used, that is, the drawing order is displayed. In general, the field SmID is selected and displayed according to the same sorting rule. Currently, only the Display Order field of a single Vector Layer or a single Thematic Map Layer Settings object is supported. As shown in the figure below, the SmID of object 1 is 1, and the SmID of object 2 is 2. Ascending and Descending are performed according to the SmID field, and the results are as follows:
Field |
Sort |
Illustration |
SmID |
Ascending |
 |
SmID |
Descending order |
 |
As shown in the following figure: Adjust the Display Order of A, B and C objects, sort them in ascending order for the first time according to the ID field, and then sort them in descending order according to the second field Name to get the results as shown in the following figure.
 |
Note:
- Optimize Cross becomes invalid after the object Display Order is set.
- If multiple sequence fields need to be set, "?" Can be called to separate the Field Settings, for example: field1 ASC, field2 desc.
- The setting of Display Order will be saved to Current Map and Workspace, which prevents users from setting repeatedly and improves the efficiency of drawing.
Set Layer Join Attribute Table
Click The Set Join Attribute Table.. button, set the associated field to connect to the external table, and then filter the content in the display layer by building the Filter with the participation of the external table field. Please refer to the Filter objects in the display map for the specific operation steps.


