Modify 3D Graph Map
Instructions for use
The 3D Graph Map "window is used to manage all the 3D Thematic Map layers in the scene. In the 3D Graph Map" window, you can set the content of the Modify Thematic Map, so as to change the original thematic map to obtain a new thematic map that is more in line with the user's needs.
Use the "3D Graph Map" window to modify the settings of a certain 3D Graph Map, which is realized through the setting items provided in the window. The following steps will introduce the functions and setting methods of each item in detail.
Operation steps
- Select a certain 3D Graph Map layer as the current layer, and then double-click the thematic layer to pop up the "3D Graph Map" window, in which the setting information of the selected 3D Graph Map is currently displayed.
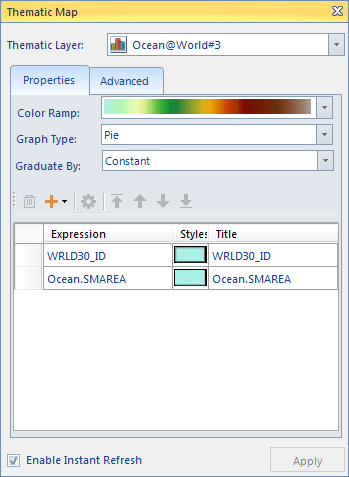
- Thematic Map Layer: The "Thematic Map Layer:" item in the "3D Graph Map" Window "is used to set and display the 3D Thematic Map contents currently rendered and edited in the" 3D Graph Map "Window".
- Color Scheme: The color schemes provided by the system are listed in the drop-down list of the "Color Scheme:" combo box. Select the desired color scheme. Then the system will Color SchemeAutomatic Allocation the theme style corresponding to each rendering field value according to the selection. The user can click the Drop-down Button on the right side of the combo box to select a Color Scheme in the pop-up drop-down list, and each Statistic Field of the current 3D Graph Map is assigned with a different color according to the color change mode of the Color Scheme.
- Diagrams Type: Currently, the system provides three kinds of three-dimensional statistical charts for users to choose: histogram, pie chart and Stacked Bar. The user can select the desired Diagrams Type in the pop-up drop-down list by clicking the Drop-down Button to the right of the "Graph Type:" item.
- Calculator Method: is used to determine the size of the statistical chart and the proportion of each Thematic variable in the statistical chart. The system provides three Calculator Methods for statistical values: constant, logarithm, and square root. Logarithmic and square root statistics Calculator Method cannot be selected for fields with negative values.
- Constant: The grading operation is based on the linear proportion of the original value in the property table.
- Logarithm: The grading operation is performed according to the linear proportion of the natural logarithm of the original value in the attribute table.
- Square Root: The grading operation is based on the linear proportion of the square root of the original value in the attribute table.
- Add or Remove Field: Statistical Thematic Map can reach the One or More Field value through Diagram. The Add
 and Remove buttons
  on the toolbar in the middle of the Properties tab allow you to add or remove Statistic Fields to the current Statistical Thematic Map. The current Statistical Thematic Map will be re-graphed in real time according to the modified Thematic variable, and the Display Effects will be refreshed.
 - Statistical Chart Style Settings: Use the Style Settings button in the toolbar in the middle of the "Properties" tab, or click the Style Settings button in each field in the field list, to set the style of the statistical chart.
 "Style" button: Select one in the Statistic Field list and click the button to open the " Fill Symbol Selector "window (Please refer to" Set the Fill Style of the statistics symbol of the selected field "in the Set Fill symbol style for detailed operation steps. The user can also directly click the "Style" item of the corresponding field in the field list to modify the style of the statistical symbol of the field.
- Up and Down Move Field: The user can change the position of the selected field in the list box in the list through the four Move Field buttons
 in the toolbar in the middle of the "Properties" tab. The position of a field in the list box affects its position in the Statistical Thematic Map you make.
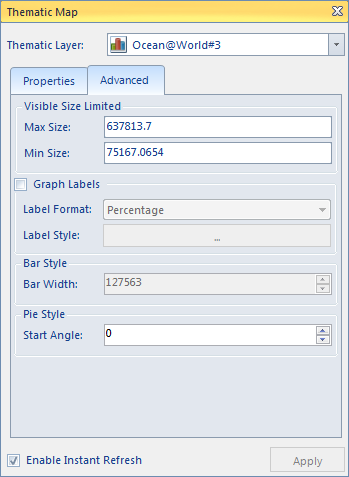
 - "Visible Size Limited" Area: " Sets the maximum and minimum values for the 3D Graph Map statistic symbol Display. The Display Size for all graphs changes gradually between the maximum and minimum values. Application will automatically calculate the appropriate maximum display value and minimum display value. The calculation idea is similar to that of the two-dimensional statistical chart. It is recommended to use the default value. The value unit is meter.
- Maximum Display Value: Sets the Display Size of the statistical symbol of the maximum statistical object.
- Minimum Display Value: Sets the Display Size of the statistical symbol of the minimum statistical object.
- "Graph Labels" Area: " You can set whether to display the text annotation on the statistical chart. To add Graph Labels, select the check box. The Markup Format combo box and the Label Style "button are available. You can set the Statistical Thematic Map text display format and the Text Annotation style.
- Marking format: The system provides five display formats for Statistical Thematic Map text: percentage, true value, title, title + percentage, and title + true value. The user can select the text format marked on the current statistical chart as required.
- Label Style: Sets the style of the annotation text on the current statistical chart. The user can click the button on the right side of the label to set the style of the statistical graph text annotation in the pop-up Text Style dialog box.
- Bar Styles:
- Column Width: It is used to set the width of each column in the histogram. The default value is half of the maximum width of the current histogram. The desired width of the histogram can be set in the spin box to the right of the label. The value can be between 0 and the maximum width, otherwise the setting is invalid.
- Pie Styles: Used to set the Start Angle of the pie chart.
- Start Angle: Set the Start Angle of the pie chart. The default value is the horizontal forward direction.
The Parameter Settings - in the Statistical Thematic Map "window will be reflected to the corresponding thematic map layer in the current scene in real time, that is, what you see is what you get. You can also disable Enable Real-time Refresh by unchecking the Enable Instant Refresh "checkbox at the bottom of the dialog box. If the "Enable Instant Refresh" "check box is not checked, the user can click the" Apply "button at the bottom of the dialog box to apply the Parameter Settings in the dialog box to the current thematic map after completing the Parameter Settings.
When making a 3D Graph Map based on a 3D layer of the face Vector Dataset type, the contents displayed in the 3D Graph Map "window are shown in the following figure.
 |  |
| Properties tab | Advanced tab |
"The 3D Graph Map" window contains two tabbed pages, Properties and Advanced. ". Details are as follows:
Properties tab:
用于设置当3D Graph Map中的统计图的风格样式,在该选项卡中的所有设置都会实时反映到当前3D Graph Map中,即所见即所得。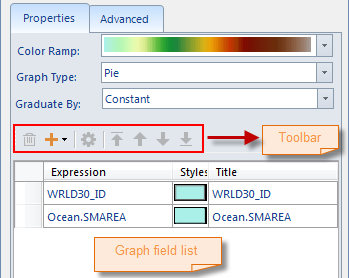 |
| Figure: Properties tab of the 3D Graph Map "window |
Advanced tab:
It is used to perform Advanced Settings on the statistical chart in the current 3D Graph Map.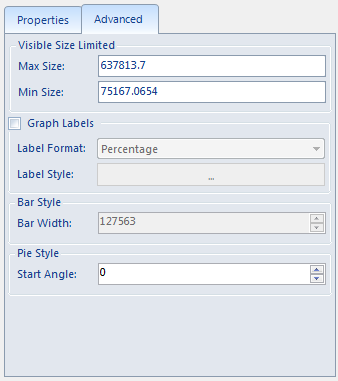 |
| Figure: 3D Graph Map "window Advanced tab |
Remark
- The 3D Graph Map made and modified by the user can be saved as a template so that it can be applied to the thematic map making of other layers. For details of Save as thematic map template, please refer to
- When Create Thematic Map in the Use Template mode, the user can directly select the saved template in the drop-down menu of the Template Drop-down Button to apply it to the production of other thematic maps.
 Related topics
 Making 3D Graph Map Based on Template


 : Top button to move the selected field up to the top of the field list.
  : Move Up button to move the selected field up one position.
  : Move Down button to move the selected field down one position.
  : Bottom button to move the selected field down to the bottom of the field list.