


Instructions for use
Sunlight Analysis refers to the calculation of the length of time that the area can be illuminated by the sun in a certain period of time according to the longitude and latitude range of the specified area. At the same time, according to the specified maximum and minimum heights, sampling distance and sampling frequency, the lighting information in the specified area is obtained, and the lighting value represents the percentage of the sunshine time in the area in the time from Start Time to End Time.
The Sunlight Analysis is a GPU-based analysis of sunlight, which is less accurate than data-based " Sunlight Analysis" ", but can be analyzed in a wide range.
Principles of analysis
Geographical location is an important factor in determining the spatial variation of Sun-illumination. Different longitudes and latitudes, shadows cast by model elements and other factors will affect the length of sunshine time received by a region. Sunlight Analysis takes into account the diurnal and seasonal variations in the angle of the sun and the effects of shadows cast by the surrounding terrain to derive daylighting information within the Specify Range as a percentage of the total time analyzed.
Application scenario
This function is widely used in civil engineering, urban planning and landscape analysis, for example:
- In urban planning, the Sunlight Analysis function can output the suitability model as an important reference for site selection.
Operation steps
 |
| Sunlight Analysis results |
- On the 3D Analysis tab, in the Spatial Analysis group, click
 the button to bring up the 3D Spatial Analysis "panel.
 - There are three ways to add a Sunlight Analysis region in the scene: draw a face, Mouse select 3D region, and import a 3D face. The specific operation methods are as follows:
- Click the button in
 the toolbar, move the mouse to the scene, click the left mouse button on the Model Data surface to draw Analysis Bounds, click the right mouse button to end the drawing, and determine the scope of Sunlight Analysis. Its drawing operation mode is the same as the polygon drawing mode.
 - If a 3D Region Dataset has been added to the current scene, click the button in
 the toolbar, select the 3D face as the analysis area, and right-click to end. Select The Sunlight Analysis "node
 - in the 3D Spatial Analysis" panel, and click the button in
 the toolbar to pop up the Import analysis range "dialog box. Select 3D Region Dataset in the dialog box to import as the analysis area, and set the Datasource, Dataset, name, minimum/maximum height, sampling distance and other Parameters in the dialog box.
- Click the button in
- Select one or more analysis records in the analysis record list to perform Parameter Settings and Property Settings in the 3D Spatial Analysis panel.
- Parameter Settings The related Parameter Settings provided are: Lighting rate color table, maximum and minimum height settings, sampling distance, etc. Parameter Settings:
- Lighting Rate Color Table: It is used to set the display color of the lighting rate in the analysis area. The display color is different if the lighting rate is different.
- Minimum Height: indicates the height of the Bottom Altitude of the analysis area relative to the center point of the drawing surface, and the unit is m. If it is set to 1, it indicates that the Bottom Altitude of the analysis area is the elevation of the center point of the drawing surface + 1m.
- Maximum height: default is 20m. Indicates the relative height of the Top Altitude of the analysis area to the center point of the drawing surface, in meters. If set to 10, it indicates that the Top Altitude of the analysis area is the elevation of the center point of the drawing surface + 10 meters.
- Sampling Distance: refers to the frequency of Output Sample Point within the specified plane and height range. The unit is meter, and the default sampling distance is 5 meters, that is, within the specified Analysis Bounds and height, a sample point of daylighting rate is output every 5 meters.
- Time Settings The related Parameter Settings provided are: Start Time, End Time, Sampling Frequency, etc. Parameter Settings:
- Start Time: It is used to set the Start Time of Sunlight Analysis. You can enter the specific time of year, month, day, hour, minute and second according to the given time format, or select a time of year, month, day, hour, minute and second in the text box by clicking the mouse. Adjust the button on the right side of the text box to determine the Start Time of Sunlight Analysis.
- End Time: It is used to set the End Time of Sunlight Analysis. You can enter the specific time of year, month, day, hour, minute and second according to the given time format, or select a time of year, month, day, hour, minute and second in the text box by clicking the mouse. Adjust with the button on the right side of the text box to determine the End Time of Sunlight Analysis.
- Sampling Frequency: refers to the sunshine data of each sampling point collected according to the sampling frequency within the specified Start Time and End Time range. The unit is minute. The default sampling frequency is 5 minutes, that is, within the specified analysis time range, whether there is sunshine at each sampling point is counted every 5 minutes. Finally, the lighting rate of each sampling point is calculated.
- Parameter Settings The related Parameter Settings provided are: Lighting rate color table, maximum and minimum height settings, sampling distance, etc. Parameter Settings:
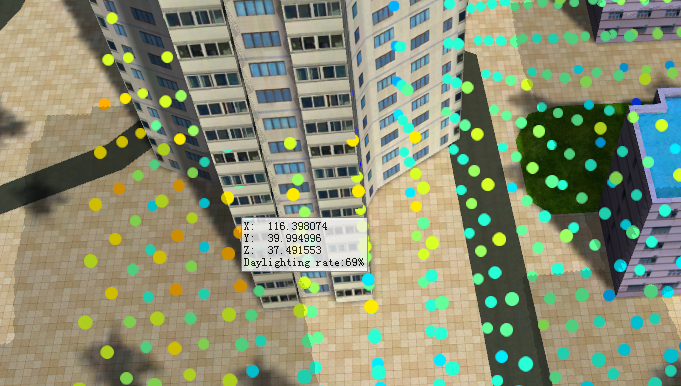
- The lighting rate within the Specify Range can be obtained according to the set parameters. Check Lighting Information Query, move the mouse to the Sunlight Analysis result area of the scene, and the coordinate position and lighting rate will be prompted, and the lighting rate cannot be modified. As shown in the following figure:
- The toolbar area provides the deletion operation of analysis records. For one or more Sunlight Analysis records selected in the panel, click the
 button to remove the selected records.
 - Sunlight Analysis supports the Export analysis range feature to export the analysis range as 3D face data. Click the
 button in the toolbar, and in the displayed "Export analysis range" dialog box, set the name to save the exported 3D face data and the Datasource, as well as the name, minimum height, maximum height, sampling distance and other information to be kept in the exported Dataset.
 - Sunlight Analysis supports the Analyst Result export function to export Analyst Results as 3D point data. Click the
 button in the toolbar, and in the displayed "Save Analysis Results" dialog box, set the exported 3D point data saving name and the Datasource, intensity field and other information.
 Caution:
 - After
- "Parameter Settings" and "Time Settings", you need to click "Apply" to set the effect.
- Currently, Desktop 3D GIS Rendering Engine V2 does not support the Sunlight Analysis feature.