


Instructions for use
The Topology Logic Diagram is a schematic diagram generated based on Network Dataset to reflect its own logical structure, which expresses the complex network in an intuitive way and simplifies the form of network expression.
It can be applied to the resource management of telecommunications, transportation, pipelines, electric power and other industries. Through the Topology Logic Diagram to view the network, it can effectively assess the existing network resource distribution, predict and plan configuration of subsequent resources.
SuperMap supports the construction of Topology Logic Diagram according to the network relationship represented by network arcs and network nodes, which facilitates the inspection of network connectivity and the acquisition of logical schematic diagrams of Network Data. The Topology Logic Diagram supports three layouts: tree, hierarchy, and Orthogonal rectangular Graph.
- Both the
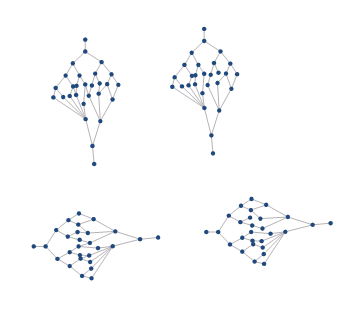
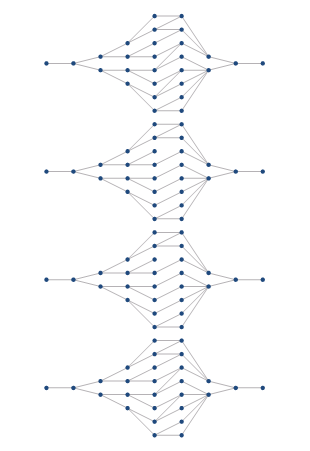
- tree graph and the hierarchical graph are applicable to a network with a definite source in a similar directed facility network. As shown in Figure 1 below, there is only one source in the network, that is, there is only one entrance in a subnet, and the others are all exits. This kind of network can generate tree graphs and hierarchical graphs, as shown in Figure 2 and Figure 3.
- For the tree diagram, in a subnet, only single source or single sink is supported, that is, there is only one source in a subnet, and the sink is not required, as shown in Figure 2. It also supports only one sink, and the source is not required.
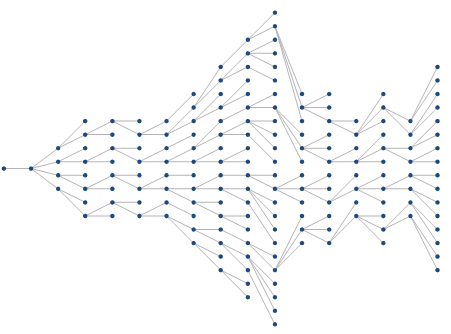
- of the tree graph. However, the tree diagram has its limitations. For example, the subnets in the network shown in Figure 4 below cannot construct a tree topology diagram. Each subnet does not meet the requirements of a single source or a single sink in the tree diagram. However, the hierarchy diagram can be handled well. Figure 5 is the hierarchy diagram of the Network Dataset:
- orthogonal diagram requires less data. The algorithm arranges the node elements and link elements in the active logic diagram orthogonally according to the rank order, and requires that the data can not have self-circular arcs (that is, in a network arc, the starting point is equal to the end point).
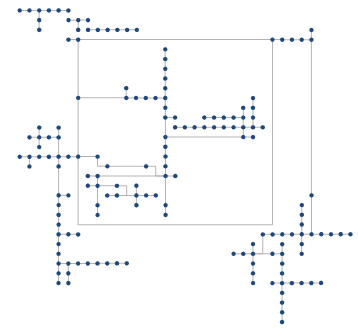
Figure 6: Orthogonal rectangular Graph.
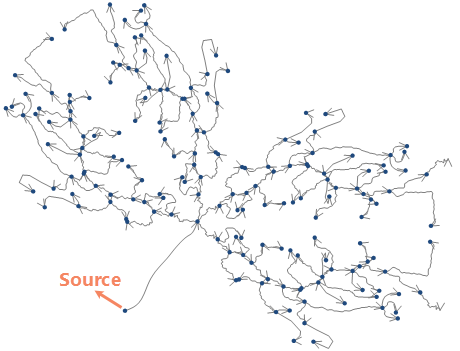 | 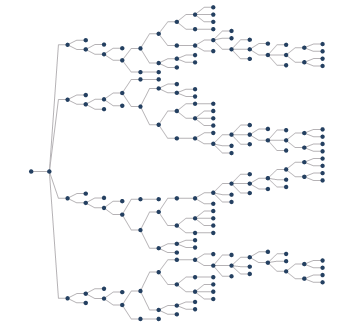 |  |
| Figure 1: Original Network Dataset | Figure 2: Tree Diagram | Figure 3: Grading diagram |
 |  |
| Figure 4: Original Network Dataset | Figure 5: Grading diagram |
Function entrance
- Data tab-& > Topology-& > Topology Logic Diagram-& > Tree/Hierarchy/Orthogonal rectangular Graph.
Parameter Description
Tree Diagram
- Layout Trend: The layout trend of the Topology Logic Diagram can be set in the tree diagram and hierarchy diagram. Graphic layout includes: From Left to Right, From Right to Left, From Top to Bottom, and From Bottom to Top. The default is from left to right.
- From Left to Right: The logic diagram starts from the root node on the left side and ends on the right side.
- From Right to Left: The logic diagram starts from the root node on the right side and ends on the left side.
- From Top to Bottom: The logic diagram starts from the root node on the top side and ends at the bottom.
- From Bottom to Top:: The logic diagram will start from the root node at the bottom and end at the top.
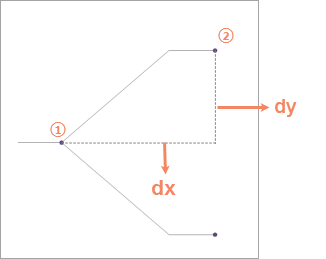
- Level Distance: Set the distance between tree levels. The default value is 50. As shown in the following figure, there are two levels from node ① to node ②, and DX is the distance between levels.
- Break ratio: Set the break ratio of the broken line. The default value is 50%, that is, break in the middle. As shown in the following figure, the connecting polyline from node ① to node ② is the polyline to be broken. Set the breaking distance to 70% to get the effect as shown in the figure.
- Node Distance: Set the distance between Topology Logic Diagram nodes. The default value is 10. As shown in the following figure, the node distance from node ① to node ② is dy. .
 |
| FIG. 7: Schematic of the parameters |
Grading Chart
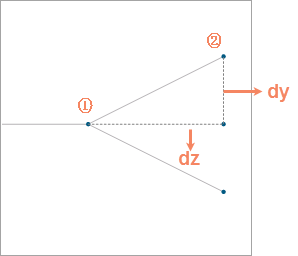
- Grade Distance: Set the distance between Topology Logic Diagram grades. The default value is 20. As shown in the following figure, there are two grades from node ① to node ②, and DZ is the distance between grades. .
- Smoothness: Set Smoothness. If Smooth Line is required for the result, you can set Smoothness greater than 1. By default, Smooth Line is not required, that is, the value is 1.
 |
| FIG. 8: Schematic of the parameters |