


Basic Statistics
Instructions for use
The Basic Statistics information of each pixel is calculated according to the input Raster Data for statistics, and the Statistics Result and gray information can be visually viewed through the histogram. The contents of statistics include: maximum value, minimum value, average value, standard deviation and variance.
Function entrance
- Spatial Analysis tab-> Raster Analysis group-> Raster Statistics-> Basic Statistics.
- Toolbox, Raster Analysis, Raster Statistics, Basic Statistics. (iDesktopX)
Parameter Description
- Source Data: Select the Raster Data to be counted, including the Datasource and Dataset where the data is located.
- Statistics Result: After statistics is executed, the contents of Basic Statistics will be displayed in the Statistics Result area. Including maximum, minimum, mean, and standard deviation.
- Max: Finds the maximum value among the grid pixel values.
- Min: Find the minimum value among the grid pixel values.
- Average value: calculates the average value of all pixel values in Raster Data.
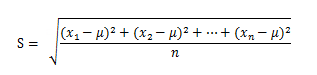
- Standard deviation: calculates the standard deviation of all pixel values in Raster Data. The standard deviation is the average of the distance of each Statistical Data from the average, which can reflect the degree of dispersion of the data. Standard deviation is the arithmetic square root of the variance. As shown in the following formula, x1, x2, X3. If xn is a set of sample data and µ is its average value, then the standard deviation formula Calculator Method is as follows:
- Variance: calculates the variance of all pixel values in Raster Data. The variance is the sum of the squares of the differences between each Statistical Data source and its mean.
- Histogram: View the histogram of the current Raster Data. Histograms are described in the Grid Histo gram .