Instructions for use
Analyze the spatial distribution law and spatial trend of the sample data, judge whether there is Spatial Autocorrelation (available spatial statistics), and then estimate the total amount or mean value of the overall data based on the sample data, such as regional population, population density, climate change, pollution, disease prevalence, etc. Provide the Statistical Inference method of six models corresponding to Random Sampling . Including Simple Random Sampling, System Random Sampling, Spatial Simple Random Sampling, Stratum Random Sampling, Six ways of Spatial Stratification Random Sampling and Sandwich Random Sampling.
Function entrance
- Spatial Statistical Analysis tab-> Spatial Sampling and Statistical Inference-> Statistical Inference. (iDesktopX)
- Toolbox-> Spatial Statistical Analysis-> Spatial Sampling and Statistical Inference-> Statistical Inference. (iDesktopX)
Parameter Description
- Source Data: Set the Dataset for Statistical Inference and the Datasource.
- Stratum Data: Set the Stratum Data set of Sandwich Random Sampling and its Datasource. Stratum Data refers to the study area based on knowledge and experience, Historical Data and auxiliary data according to the minimum variance within the layer, The target with the largest inter-layer variance ( Spatial differentiation is significant) is obtained by stratifying the study area. The division layer can be geographical space or attribute space, that is, classification, and the same layer does not require connection. (Required only when Sandwich Random Sampling method is selected)
- Reporting Unit Data: Set the Reporting Unit Data set and Datasource of Sandwich Random Sampling. A reporting unit is a unit at the top level in a "sandwich" model, which may be an administrative unit, a natural unit, a grid unit, or any other spatial unit of interest to the user. The final result is an estimate for each reporting unit. (Required only when Sandwich Random Sampling method is selected)
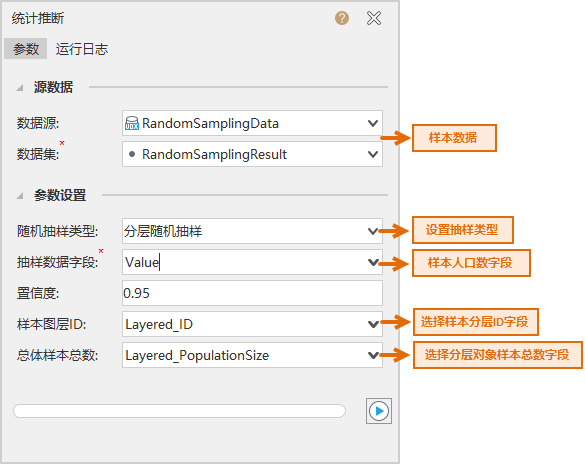
- Parameter Settings: Set according to different Random Sampling types.
Random Sampling type: including Simple Random Sampling, System Random Sampling, Spatial Simple Random Sampling, Stratum Random Sampling, Spatial Stratification Random Sampling and Sandwich Random Sampling. According to the characteristics of the data, the appropriate sampling model is selected for Statistical Inference.
Sample Data Field: The specified sample data field.
Confidence level: According to the assumption of mean normal distribution, how much the user wants to believe that the result is credible. As explained in the Basic Vocabulary of Spatial Statistical Analysis .
Sample Layer ID: The layer ID to which the specified sample belongs (the system will automatically generate a Layered _ ID). (Required when Stratum Random Sampling, Spatial Stratification Random Sampling, and Sandwich Random Sampling methods are selected)
Total number of total samples: The total number of total samples included in the specified hierarchical object (the system will automatically generate a Layered _ Population Size). (Required when Stratum Random Sampling, Spatial Stratification Random Sampling, and Sandwich Random Sampling methods are selected)
Application case
In order to know the total population of Heshun County in Shanxi Province in 1998, it is necessary to select administrative villages from 326 administrative villages by taking the town administrative area as the layer for sampling survey. It is required that the standard deviation of the estimated total population should not exceed 126 26, that is, the mean variance of the estimated total population set in the software should not exceed 1500, and the number of administrative villages in each town should be known. The standard deviation of the population of each stratified village can be estimated from the previous survey data.
According to the cases in the Stratum Random Sampling, the sample points have been obtained, and the artificial total number of samples has been input. At this time, the mean value of the total population of Heshun County, Shanxi Province in 1998 can be inferred according to the Statistical Inference function. The specific description is as follows:
- Case Data: Click here to download < a class = "contentpage hyperlink" href = "./data/Random SamplingData. Zip" "=" "> Case data for Stratum Random Sampling and predictive inference , download and unzip.
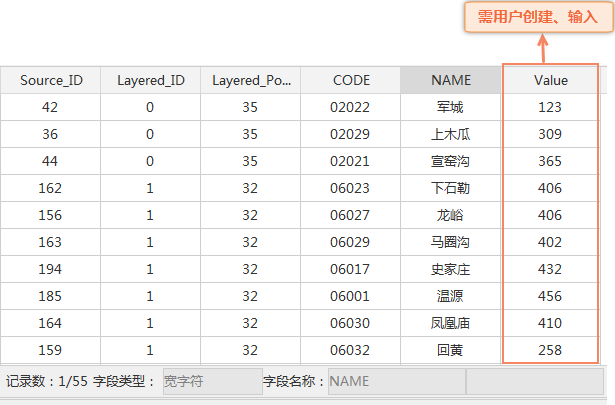
- hs _ sampling frame: Administrative Village Point Dataset ;
- hs _ town: the administrative division data of the town, as Stratum Data, CODE in the attribute table is the number of the town, NAME is the name of the town, NUM is the number of administrative villages of the town, and STDEV is the standard deviation of the population of the town surveyed in the past;
- Random SamplingResult: sample data of administrative villages, where the Value field is the total population of the sample point in 1998;
- Parameter Settings: After downloading the above case data, open the RandomSamplingData. Udbx on the desktop. After opening the Statistical Inference dialog box, the Parameter Settings are as shown in the following figure. After setting the parameters such as source data, sample type, sample data, sample layer ID, and total number of samples, click the Execute button to perform Statistical Inference.
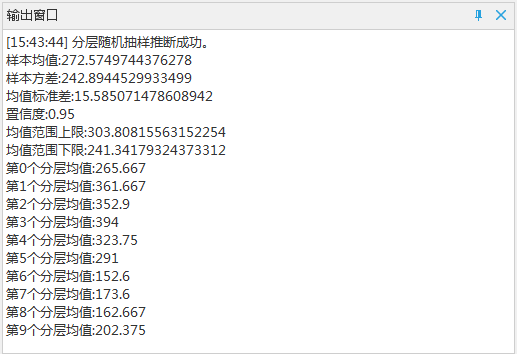
- Result: According to the population data of 55 administrative villages, the average population of the total population of the administrative villages is 272.57, and the standard deviation, the mean value of each layer of samples and other parameters, of which the standard deviation is 242.89, less than 1500, which meets the requirements of the case. The results in the Output Window are shown in the following figure: