Instructions for use
Samples are drawn in geographic space with equal probability, and various sampling methods and sampling plans are considered for Spatial attributes such as Spatial Autocorrelation and spatial heterogeneity. Including Simple Random Sampling, System Random Sampling, Spatial Simple Random Sampling, Stratum Random Sampling, Six ways of Spatial Stratification Random Sampling and Sandwich Random Sampling.
Function entrance
- Spatial Statistical Analysis tab, Spatial Sampling and Statistical Inference, Random Sampling. (iDesktopX)
- Toolbox-> Spatial Statistical Analysis-> Spatial Sampling and Statistical Inference-> Random Sampling. (iDesktopX)
Parameter Description
- Source Data: Set the Dataset for Random Sampling and the Datasource where it is located.
- Sampling Extent/Stratum Data: Set the sampling range or Stratum Data set and its Datasource. Stratum Data refers to the study area based on knowledge and experience, Historical Data and auxiliary data according to the minimum variance within the layer, The target with the largest inter-layer variance ( Spatial differentiation is significant) is obtained by stratifying the study area. The division layer can be geographical space or attribute space, that is, classification, and the same layer does not require connection.
- Reporting Unit Data: Set the Reporting Unit Data set and Datasource of Sandwich Random Sampling. A reporting unit is a unit at the top level in a "sandwich" model, which may be an administrative unit, a natural unit, a grid unit, or any other spatial unit of interest to the user. The final result is an estimate for each reporting unit. (Required only when Sandwich Random Sampling method is selected)
- Parameter Settings: Set according to different Random Sampling types.
- Uncheck: indicates to use the scale value. Scale values have dimensions, such as: temperature (degrees Celsius), precipitation (millimeters), yield (tons), heavy metal content (grams per Cubic Centimeters), population density (number of people per square kilometer).
- Check: indicates to use the proportional value. Proportional values are dimensionless, such as planting percentage (%), incidence rate (%), sex ratio (%), etc.
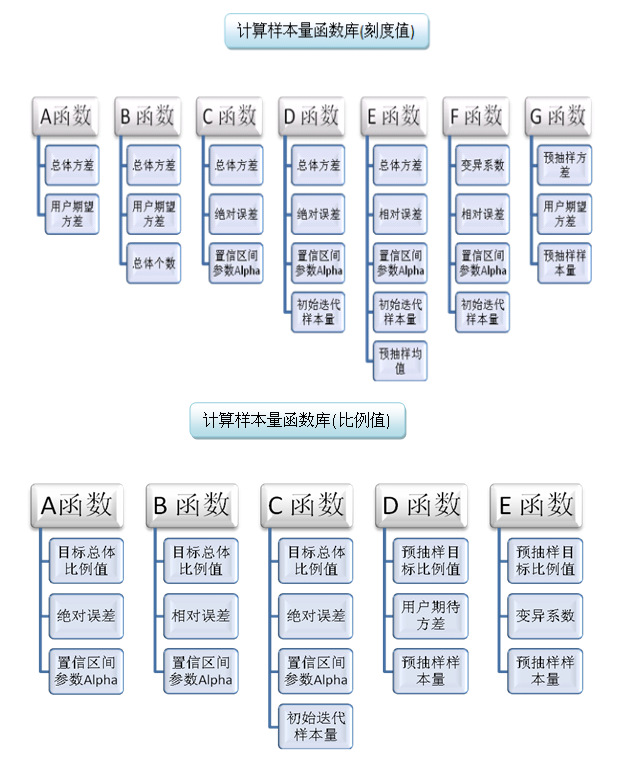
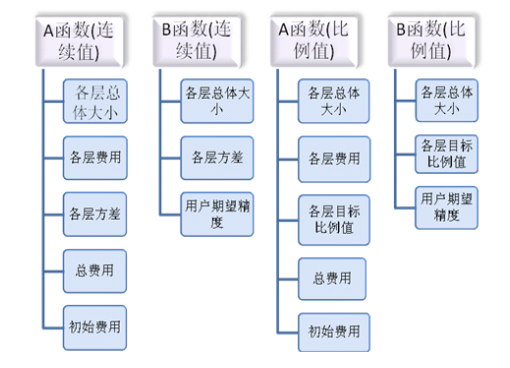
- For the simple random, systematic and spatial Random Sampling model, the functions used to calculate the sample size are shown in the following figure:
- All the functions used in the stratified sampling, spatial stratified sampling, and "sandwich" sampling models to calculate the sample size are shown in the following figure:
- Result Data: Set Result Dataset and its Datasource.
Random Sampling type: including Simple Random Sampling, System Random Sampling, Spatial Simple Random Sampling, Stratum Random Sampling, Spatial Stratification Random Sampling and Sandwich Random Sampling, and selects the appropriate sampling model for spatial sampling according to the data characteristics.
Whether to use proportional value: There are two types of value types: scale value and proportional value.
Sampling resolution: For the vector base map, during the sampling process, the base map needs to be gridded to obtain the sampling space (each gridded grid is a sample unit that may be sampled). The sampling resolution is the width of each minimum grid.
Sampling Enlargement Ratio: The actual sampling sample size is the percentage of sample enlargement obtained by multiplying the theoretical value calculated by the user's Input Parameter by the sample enlargement ratio. Some samples are not available or the sample data may be lost, so the calculated sample size is increased according to a certain proportion according to the expansion proportion selected by the user as the final sample obtained by the user. Defaults to 0.1
Spatial correlation coefficient: Morans can be calculated through the Spatial Autocorrelation function. (Required only when Spatial Simple Random Sampling method is selected)
Sample Calculation Function: The function to calculate the sample size. All of the functions used to calculate the sample size vary depending on the sampling model chosen and the type of input value selected.
Parameters explained below:
Population Variance: The true variance in the sampling space (the variance calculated from the measured values obtained from each possible sample), which is generally derived from the previous survey or relevant historical data and cannot be accurately obtained.
User expected variance: the estimated variance that the user expects to obtain in this sample survey.
Total cost: the total cost budget of sampling (only for reference, not involved in the calculation, and not binding on the basic cost and the cost of a single sample).
Initial Charge: The specified initial charge.
Variance Field of Each Layer: The specified variance field of each layer.
Layer Cost Field: The specified layer cost field.
Absolute error: estimate minus true. In sampling theory, the variance of a population estimate.
Relative Error: The sample mean minus the actual Target divided by the Target.
Confidence Interval Parameter: According to the assumption of normal distribution of the mean, to what extent the user wants to believe that the result is credible. The confidence level of the result obtained by the user is expressed by (1-alpha/2)%.
Initial Iteration Sample Size: When calculating the sampling sample size, you need to use the t distribution. The calculation of the t distribution value requires two parameters: one is the sample size, and the other is alpha. In the calculation, the t distribution will be used many times, and the sample size is obtained by iterative calculation and final convergence. The initial iterative sample size is the sample size used to calculate the t value for the first time, and the system defaults to 1. (It is better not to modify)
Pre-sampling mean value: before the formal sampling, the user conducts a survey within a certain range to obtain the mean value of the sample.
Pre-sampling Variance: Sample Variance is obtained during pre-sampling.
Pre-sampling sample size: during pre-sampling, the number of samples used for sampling is obtained.
Coefficient of variation: The ratio of the standard deviation to the mean is called the coefficient of variation, which is recorded as the C. V. The coefficient of variation can eliminate the influence of different units and (or) means on the comparison of the degree of variation of two or more data.
Sampling Enlargement Ratio: The actual sampling sample size is the percentage of sample enlargement obtained by multiplying the theoretical value calculated by the user's Input Parameter by the sample enlargement ratio. Some samples are not available or the sample data may be lost, so the calculated sample size is increased according to a certain proportion according to the expansion proportion selected by the user as the final sample obtained by the user.
Overall percentage value: The percentage of the value used to represent the target of the survey.
Whether consumption is unknown: Set whether consumption is unknown.
Variance Field of Each Layer: The specified variance field of each layer.
Application case
In order to know the total population of Heshun County in Shanxi Province in 1998, it is necessary to select administrative villages from 326 administrative villages with 10 towns as the layer for sampling survey. The standard deviation of the estimated total population should not exceed the 12626, that is, the mean variance of the estimated total population set in the software should not exceed 1500, and the number of administrative villages in each town should be known. The standard deviation of the population of each stratified village can be estimated from the previous survey data.
- Case Data: Click here to download < a class = "contentpage hyperlink" href = "./data/Random SamplingData. Zip" "=" "> Case data for Stratum Random Sampling and predictive inference , download and unzip.
- hs _ sampling frame: Administrative Village Point Dataset ;
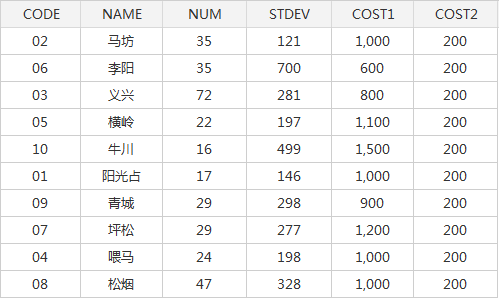
- hs _ town: the administrative division data of the town, as Stratum Data, CODE in the attribute table is the number of the town, NAME is the name of the town, NUM is the number of administrative villages of the town, and STDEV is the standard deviation of the population of the town surveyed in the past;
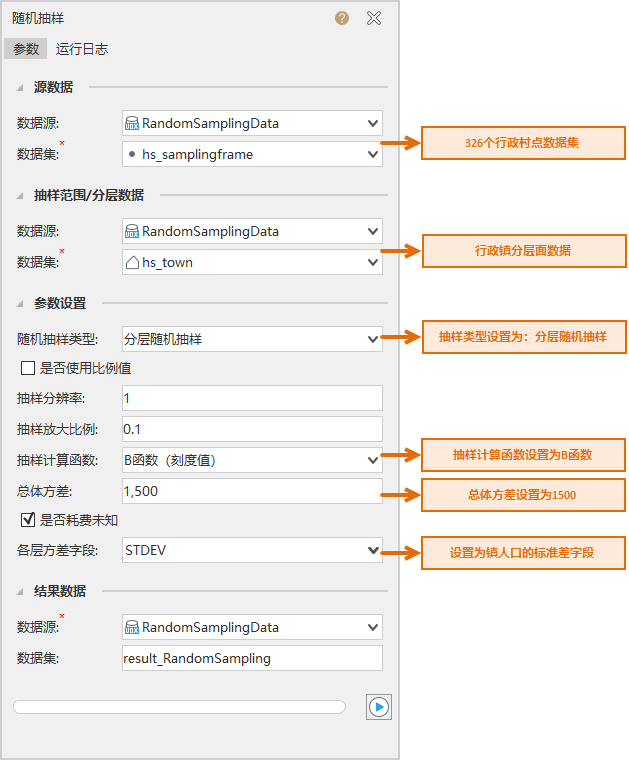
- Parameter Settings: After downloading the above case data, open the RandomSamplingData. Udbx on the desktop, and Parameter Settings is as shown in the following figure. After setting parameters such as source data, Stratum Data, sampling type, calculation function and population variance, click Execute to perform Stratum Random Sampling.
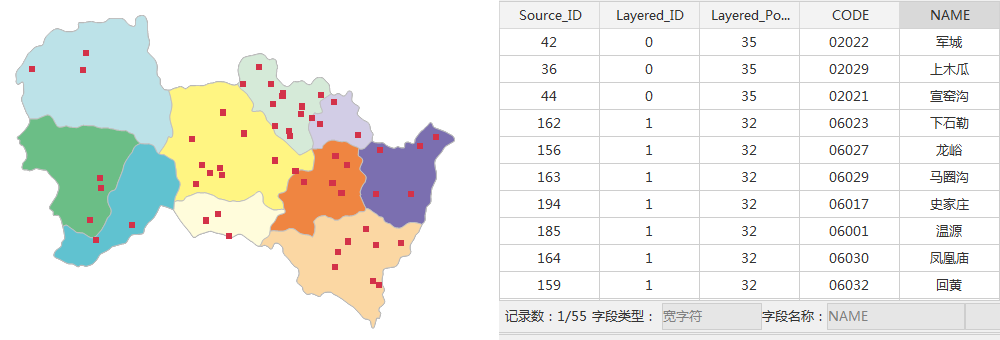
- Result: According to the above parameters, 55 administrative villages were sampled as sample points, in which the Layered _ ID was the ID of the layered layer, and the Layered _ Population Size was the total number of all villages in the layer where the sample points were located. The space and Attributes of the sample point data are as follows:
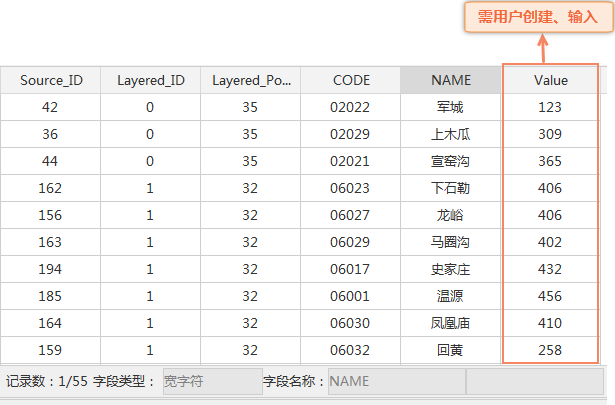
- Result processing: After obtaining the sample point data, the user needs to input the population of the sample administrative village. The operation steps are as follows:
- New Field: Select the result _ Random SamplingDataset, right click and select Property, and create a new Value field (Short) in the Property Sheet panel.
- Input attribute: input the total population of each sample point in turn, and the processed Data Information is as follows: