 Introduction
The map performance diagnosis aims at diagnosing the map performance in the current window. The results have the time cost of drawing map, time cost of query, time cost of each layer under different scales. The time costs are shown as bar chart. Draw (ms) means the time cost of showing data on the map. Search (ms) means the time cost of reading data from the datasource engine.
If you find the map refresh is slow when you zoom, pan or refresh the map, you'd better use Map Performance Diagnose to check the total time cost and the time cost of each layer. You can optimize the layers which take more time so as to improve the map performance.
Performance Diagnosis
- Functional Entrance: Open your map first, then select Maps > Mapping > Diagnose Performance. In the popup panel, you can check the spent time of getting data, drawing data, etc. Unit: ms.
- Diagnostic Modes: The application supports real-time diagnosis and manual diagnosis. You can check Enable Real-time Diagnosis to let the application monitor the time cost of refreshing your map instantly. If you uncheck the checkbox, you can pan or zoom the map first, and then click on the Diagnose button to get the diagnosis results, like the time cost.
- The diagnosis results are shown in three ways: scale tree, layer time-consumed statistics, all diagnosis results, and maps in different scales and ranges.
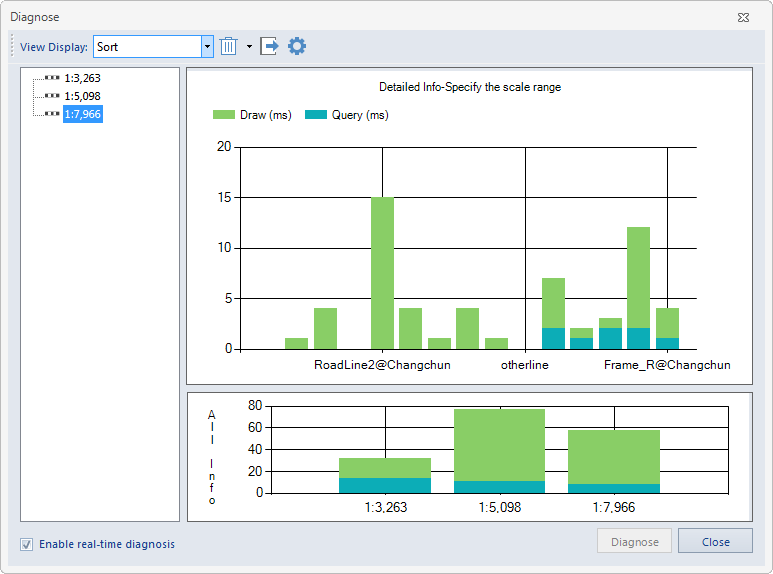
Diagnose Map Performance - Diagnosis List: Displays all records that the current map has been diagnosed, from where you can select an item to check the corresponding diagnostic results. And the map window will display the corresponding map view.
- Count by Layer Time: The bars show the draw time, data-getting time, and query time of each layer in the specified scale and range. If you hover your mouse on a bar, you can see the layer's title, draw time, and query time. Meanwhile, you can double-click on a bar to position the layer in the Layer Manager. With the feature, you can optimize time-consuming layers. For related operations, please refer to Optimize Drawing and Query Time Optimization.
- All Information Statistics: It shows all information statistics. When you move your mouse to a bar, you can see the map name, scale, center location, and layer number. If you click a bar or scale node, you can see the time cost of each layer in the detailed information statistics.
Note: the Diagnose Performance dialog box can display the diagnostic results of one map. To diagnose another map, please empty the existing diagnostic records first.
- The toolbar organizes a series of tools to manage diagnostic records and results.
- Add: click the button to add the map contents of 5 areas (center, top left, top right, left bottom, and right bottom) in different scales, which can diagnose the map performance roundly.
- Remove: removes the selected records and all records.
- Import: import a diagnostic list (*.xml) to diagnose your map according to the list.
- Export: export diagnostic checklists and report.
- Export Diagnosis: export the diagnosis list resulting in a *.xml file.
- Export Report: export the diagnostic result to a *.xml file. The diagnostic result records the cost time of the map in different scales and centers and all visible layers' query time, data-getting time, drawing time, and other time.
- Settings: click the button to open the Settings dialog box. In the box, you can set the colors and display modes of different categories of diagnostic results. Among them, the application provides 6 display modes: Sort, Merge, Query Time, Only display the data-getting time, Draw Time, and Only display other consumed time.