Time cost for map drawing is time cost for display and rendering. To optimize time cost for map drawing, you need to optimize the display effect of map features. You can optimize from following aspects: data volume, number of display objects, display effect, etc.
Optimize Dataset
Dataset optimization includes dataset type, field index, data repetition, data complicity, and error checking.
- Dataset Type
- Field Index
- Data Error
Data error contains data bounds error unreasonable data.
- Data bounds error
- Unreasonable Data
- In a map, there might be many data layers with millions of records.
- There are a large number of data layers, and the number of objects in a layer is small.
- There are large number of roads with the length less than 10m, rivers or parks with area less than 100 square meters.
- Problem 1: Divide data according to type, or geographical areas.
- Problem 2: Merge data of the same type.
- Problem 3: Determine standards for shortest roads and smallest areas. If the length of lines cannot be less than 10m and areas cannot be smaller than 100 square meters. Following operations are recommended.
- Dissolve line and polygon dataset, and merge sliver polygons for polygon dataset.
- Associate map and attributes, sort ascending SmLength and SmArea, to check whether there are objects with short length and small area.
- Modify tolerance for dissolving and merging silver polygons to make sure that there are no real objects with length or area smaller than the tolerance.
- Sort ascending SmLength or SmArea, and delete objects with length or area smaller than the tolerance.
Data bounds error is primarily caused by abnormal coordinates of data. Methods for checking data bounds error is as follows:
Add a dataset to a map and display the data in full extent. If all map data display at a very small area on the map, there might be abnormal coordinates.
Check coordinates of the dataset. If it is a point dataset, check SMX and SMY. If it is line and polygon dataset, check SmSdriW, SmSdriN, SmSdriE, SmSdriS. You can sort ascending the fields to see whether there are abnormal data.
Following aspects will affect map display efficiency.
- Reduce the complicity
Since a simple dataset does not need to store object style and is smaller in size compared to a CAD dataset that saves the same data, we suggest using a simple dataset instead of a CAD dataset. For example, given a line dataset and a CAD dataset that stores the same road data of an area, we test the cost times of refreshing them separately. As the following picture shows, refreshing the CAD dataset costs 500 ms while refreshing the line dataset needs 95 ms.
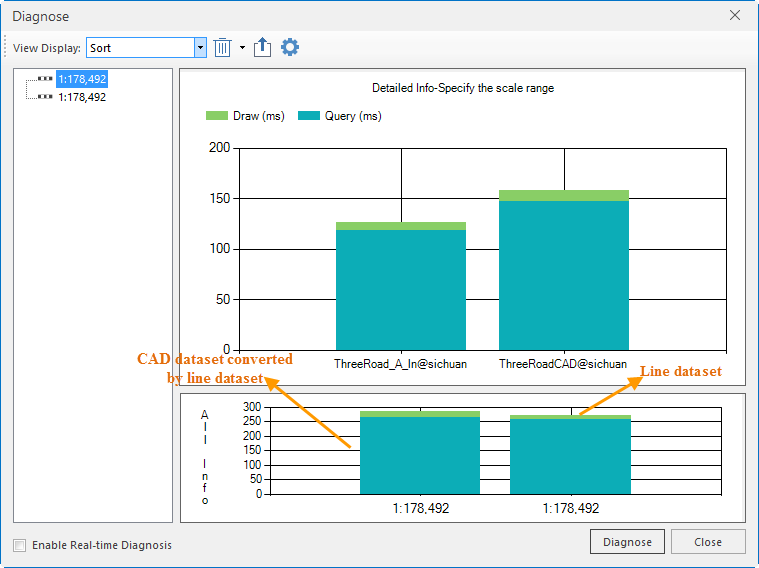 |
| Performance comparison for CAD dataset and line dataset |
Field index provides the capability to fast access of specified key-value pairs. Field index generally employs binary tree or derivative structure of binary tree. If a certain field of the dataset needs to be used for SQL query, analysis, thematic mapping, filter expression, you can create field index for this field, which can enhance map drawing efficiency.
For example, we created a label thematic map from the ThreeRoad_Ln line dataset with the field Name to label each object. Before creating a field index from the field, drawing the thematic map costed 74ms. After creating it, the cost time was 41ms. Therefore, creating a field index can enhance the efficiency of map drawing and query.
 |
| Data for map diagnosis and creating field index |
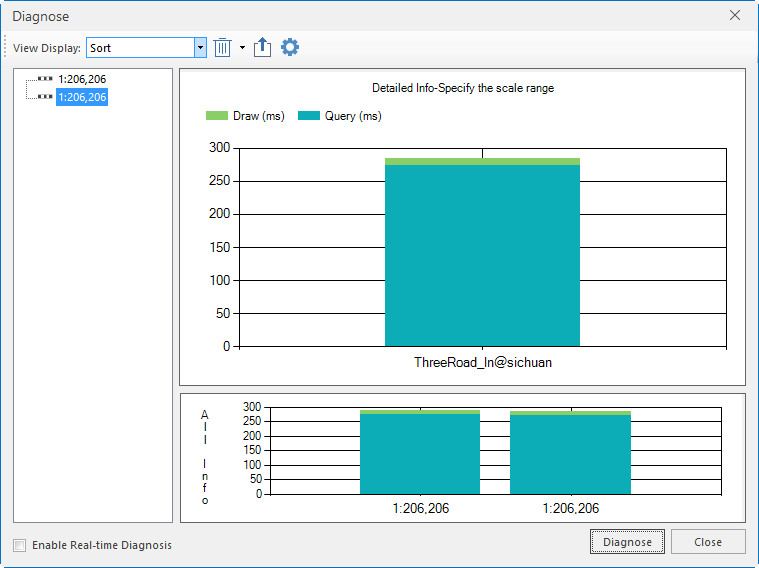 |
| Comparison for map diagnosis |
The complicity of data lies in: large number of vertices, large number of child objects. You can resample line data to reduce simplicity for line dataset. For polygon dataset, it is suggested you first convert it into line dataset and then resample the line dataset. After processing, you can construct polygon via typology. If there are too many child objects, it is suggested you split the object. Before splitting, you should check the objects in the layer to avoid islands and holes.
Avoiding and thining data
Data with large volume and annotation would have some problems for displaying at small scales: annotations will be extremely intensive. Generally we can use avoid settings of label maps.
Besides, if points in a point dataset are dense, you can use the feature Thin Points to thin points.

Map Display
Map display optimization
- Layer scales
- Layer Properties
- Map Properties
Different scales of map will display different contents. For a specific scale, not all data layers need to be displayed. Therefore, we need to control the max and min visible scales for a layer to ensure the least content for the scale. This can enhance the map browsing and operation efficiency. As shown below, for a map of China province, as we zoom in, contents for small scales is meaningless for large scales. Similarly, contents for large scales is also meaningless for small scales. Therefore, we need to arrange the contents for different scales. You can set min and max scales for a layer. When the scale of the map is smaller than the min scale or greater than the max scale, the layer will be invisible.
Set Object Display Order
For unique values, range maps, if thematic map items are symbol fill and the expression of the thematic map is composed of one field, you can set the field to object display order field, which can enhance drawing efficiency to some extent.
Object Min Display Size
When the map scale is small, there are some objects almost invisible. Therefore, you can set min display size, all objects smaller than the specified size will be invisible, therefore enhancing map refresh efficiency.
Label map layer settings
Label map of the map have great effect on map performance. It is not suggested to enable flow display. It is suggested to turn off automatic avoid when the data volume is large.
Cross Optimization
For road crosses, drawing order will be determined by the order of vectorization. This drawing order will offer the view effect that a road goes over another one. Actually, the intersection should be a cross or T turn.
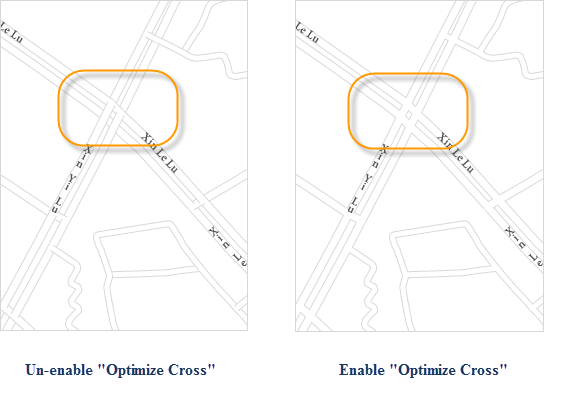 |
Enabling cross optimization will also reduce the performance of the map. You can select an alternative option. The reason for the unsatisfactory effect is that the line symbols is composed of two lines of different styles, as shown in 6 13. We can add a road twice to the map window, create two layers, and render the two road layers with the sample line symbol, and set the color of the upper road to the fill color of the road, white in this example, and set an appropriate width. Set the color of the lower road to the boundary color, gray in this example, with the width greater than the width of the upper road, therefore, simulating the line symbol composed of two different lines with different styles and width. This solution offers same effect as cross optimization, however providing better performance.
 |
Some property settings for the map may affect the performance greatly, therefore, we need to consider to use alternative solutions to realize following effects: dynamic projection, line anti-aliasing, text anti-aliasing, overlap settings. SuperMap can set anti-aliasing and overlap for a layer, therefore, without need to enable anti-aliasing or overlap settings for the entire map. Enabling dynamic projection will also have negative effect on map performance, therefore, it is suggested to make sure all data in the same map have the same projection, avoiding dynamic projection.