The linear directional mean can be used to analyze the main direction of the line object. The general linear feature usually points in one direction, where the position from the starting point points to the destination. Such lines are also often used to express some actual information, such as the vehicle track, each turn, indicating a journey;Or the trajectory of the hurricane. Of course, there are some lines that have no direction, such as contour lines. There is a line segment, they may have a bearing value, but there is no direction value, such as an extension of the fault line reflect fault direction and extension of scale, this is a description of the fault line generally is “has the northwest - southeast direction”, but do not have specific direction.
Applications
- Comparing two or more sets of lines?For example, a wildlife biologist studying the movement of elk and moose in a stream valley could calculate the directional trend of migration routes for the two species.
- Comparing features for different time periods?For example, an ornithologist could calculate the trend for falcon migration month by month. The directional mean summarizes the flight paths of several individuals and smooths out daily movements. That makes it easy to see during which month the birds travel farthest and when the migration ends.
- Evaluating felled trees in a forest to understand wind patterns and direction.
- Analyzing glacial striations, which are indicative of glacial movement.
- Identifying the general direction of auto thefts and stolen vehicle recoveries.
Function Entrances
- Click Spatial Analysis > Spatial Statistical Analysis > Measuring Geographic Distributions > Linear Directional Mean.
- Toolbox > Spatial Statistical Analysis > Measuring Geographic Distributions > Linear Directional Mean. (iDesktopX)
Main Parameters
- Source Dataset :Set up the vector data sets to be analyzed, supports points, lines, and regions three types of datasets.
- Group Field :Refers to a field that divides the analysis elements into categories. After classification, each group of objects has a central element. The Group Field can be of integer, date, or string type. Records with NULL values for the Group Field will be excluded from the analysis.
- Weight Field :Set up a numeric field for weight, for example: rank as weight field with a traffic accident, the results ellipse can not only reflect the spatial distribution of the accident can also reflect the severity of the traffic accident.
-
Ignore direction order for start and end :
- Unchecking is by default. Each line has the direction (from the start to the end) when calculating the directional mean.
- Checking the check box means each line has no directions.
- Keep Statistics Field :Refers to the retention field that sets the result data in the field list box, and the statistical type of the field value.
- Result Settings :Set up the datasource for the result data and the dataset name.
Results Output
Finally, a new feature class is created, which contains a line feature whose center is the mean center of the center of mass of all input data. The length of the line feature is equal to the mean length of all input data, and its orientation or direction is the mean direction or average direction of all input data.
The attribute values of the new line features are as follows:
- CompassA -Compass Angle (clockwise rotation in the main direction)
- DirMean -Direction Mean (rotation by counterclockwise in the positive east direction)
- CirVar -Circular Variance (the degree to which the direction of a line or orientation is off the mean)
- AveX and AveY - The average center X and Y coordinates
- AveLen - Average line length
Other attribute values are well understood except the Cirvar (thecircular variance). It is a concept similar to the standard deviation. The thecircular variance is used to indicate the degree of variation in the direction of the data that you re going to analyze. The range of variance is 0 to 1. If all the analysis data has exactly the same (or very similar) direction, the circular variance will be small (close to 0). When the input data direction spans the entire compass, the circle variance will be large (close to 1).The larger the variance, the more obvious the direction of the analysis.
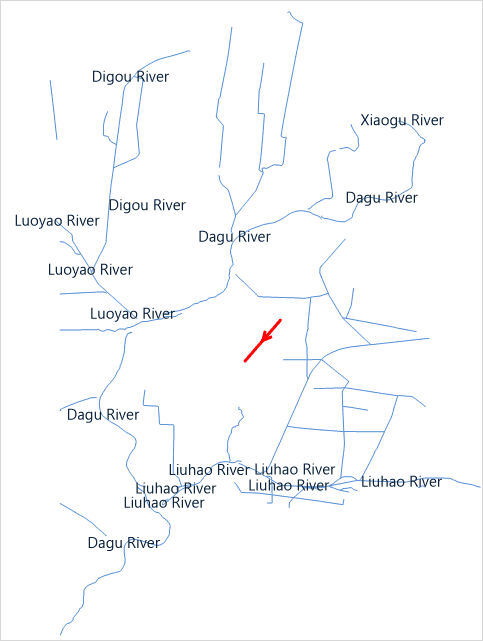
Such as: THe following picture show some rivers and affluents in the junctions of Pingdu and Jimo of Shandong. Through performing the feature Linear Directional Mean, measures their directions to get the red line in the following pictures. The mean center of all rivers’ centroids is the center of the red line. The red line length is the average length of all rivers. The direction of the red line is the mean direction of all rivers.
