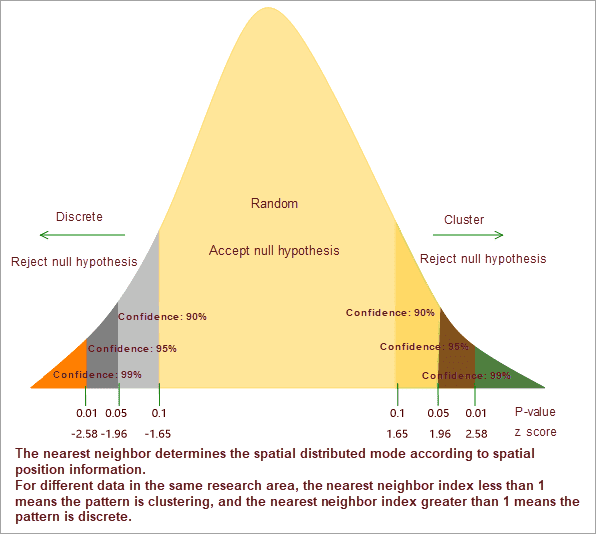
The Average Nearest Neighbor tool measures the distance between each feature centroid and its nearest neighbor’s centroid location. It then averages all these nearest neighbor distances, and you get nearest neighbor index. If the index is less than 1, the pattern exhibits clustering. If the index is greater than 1, the trend is toward dispersion. If the average distance is less than the average for a hypothetical random distribution, the distribution of the features being analyzed is considered clustered. If the average distance is greater than a hypothetical random distribution, the features are considered dispersed. The average nearest neighbor can come up with an index of the specific concentration of a data, which can be used to compare different data with the largest concentration of data.
The average nearest neighbor method is very sensitive to the Area value. Consequently, the Average Nearest Neighbor tool is most effective for comparing different features in a fixed study area. If an Area parameter value is not specified, then the area of the minimum enclosing rectangle around the input features is used.
Applications
- Evaluate competition or territory: Quantify and compare the spatial distribution of a variety of plant or animal species within a fixed study area; compare average nearest neighbor distances for different types of businesses within a city.
- Monitor changes over time: Evaluate changes in spatial clustering for a single type of business within a fixed study area over time.
- Compare an observed distribution to a control distribution: In a timber analysis, you may want to compare the pattern of harvested areas to the pattern of harvestable areas to determine if cut areas are more clustered than you would expect, given the distribution of harvestable timber overall.
Function Entrances
- Click Spatial Analysis > Spatial Statistical Analysis > Analyzing Mode > Average Nearest Neighbor. (iDesktop)
- Click Spatial Statistical Analysis > Analyzing Mode > Average Nearest Neighbor. (iDesktopX)
- Toolbox > Spatial Statistical Analysis > Analyzing Mode > Average Nearest Neighbor. (iDesktopX)
Main Parameters
- Source Dataset : Set up the vector datasets to be analyzed, supports points, lines, and regions three types of datasets.
- Research Area : Set up the area of the research region, the unit is square meter, the area value is greater than or equal 0;If the area of the study area is 0, the minimum external rectangular area of the source dataset will be automatically calculated as the area of research region.
- Measure Distance Method : Currently, only Euclidean distance calculation and Manhattanis distance calculation are supported, for more specific instructions about the two calculations, please refer to Basic Vocabulary of Spatial Statistical Analysis.
Results Description
The output is a CAD dataset and displays on a map window.
The analysis results include five parameters: the nearest neighbor index, the expected mean distance, the average observation distance, z-score, and P-value. The nearest neighbor index is the ratio of average observation distance to the expected average distance. If the nearest neighbor index is less than 1, the mode of expression is clustering. If the nearest neighbor index is greater than 1, the pattern of performance tends to spread.
Instance
Comparing the aggregation degree of residential quarters and villas in a certain area, the analysis results are as follows:
The nearest neighbor index of residential quarters in this area is 0.2143, and the nearest neighbor index of villas is 0.4708, both of which are less than 1, indicating that the distribution patterns of the two types of elements are clustered, but the degree of aggregation of residential quarters is greater.

