Function Description
This function is used to create segmented thematic maps for visualizing categorized spatial data distributions.
Supported Data Sources
- iPortal Data Resource
Supported Formats: STRUCTUREDDATA
- Uploaded Files (via AI Assistant interface)
Supported formats: CSV, Excel, GeoJSON, Shp (supported data format *.zip), maximum 200MB
1. GeoJSON data stored in JSONL format is not supported for upload;
2. Data must be uploaded via the SuperMap iPortal AI Assistant interface. Uploading directly through SuperMap iPortal may cause tool invocation failure.
Function Entrance
Two methods are available to generate segmented thematic maps.
Directly Input Segmented Thematic Map Command in the Dialog Box
- Click Dialog on the left panel of the main interface.
Click Segmented Thematic Map Command in "Instruction Center"
- Navigate to Instruction -> Map Visualization Tools on the left panel.
Operation Steps
Directly Input Segmented Thematic Map Command in the Dialog Box
In the dialog box, enter a command such as: "Use the 'Beijing-Tianjin Land Use Polygons' dataset, divide into 6 segments based on the 'Area' field according to land area size, and fill with gradient color bands", then click the Execute button.
Click Segmented Thematic Map Command in "Instruction Center"
Within the "Map Visualization Tools" section, click the Segmented Thematic Map Drawing box. The preset command will populate the dialog automatically. Click Execute to proceed.
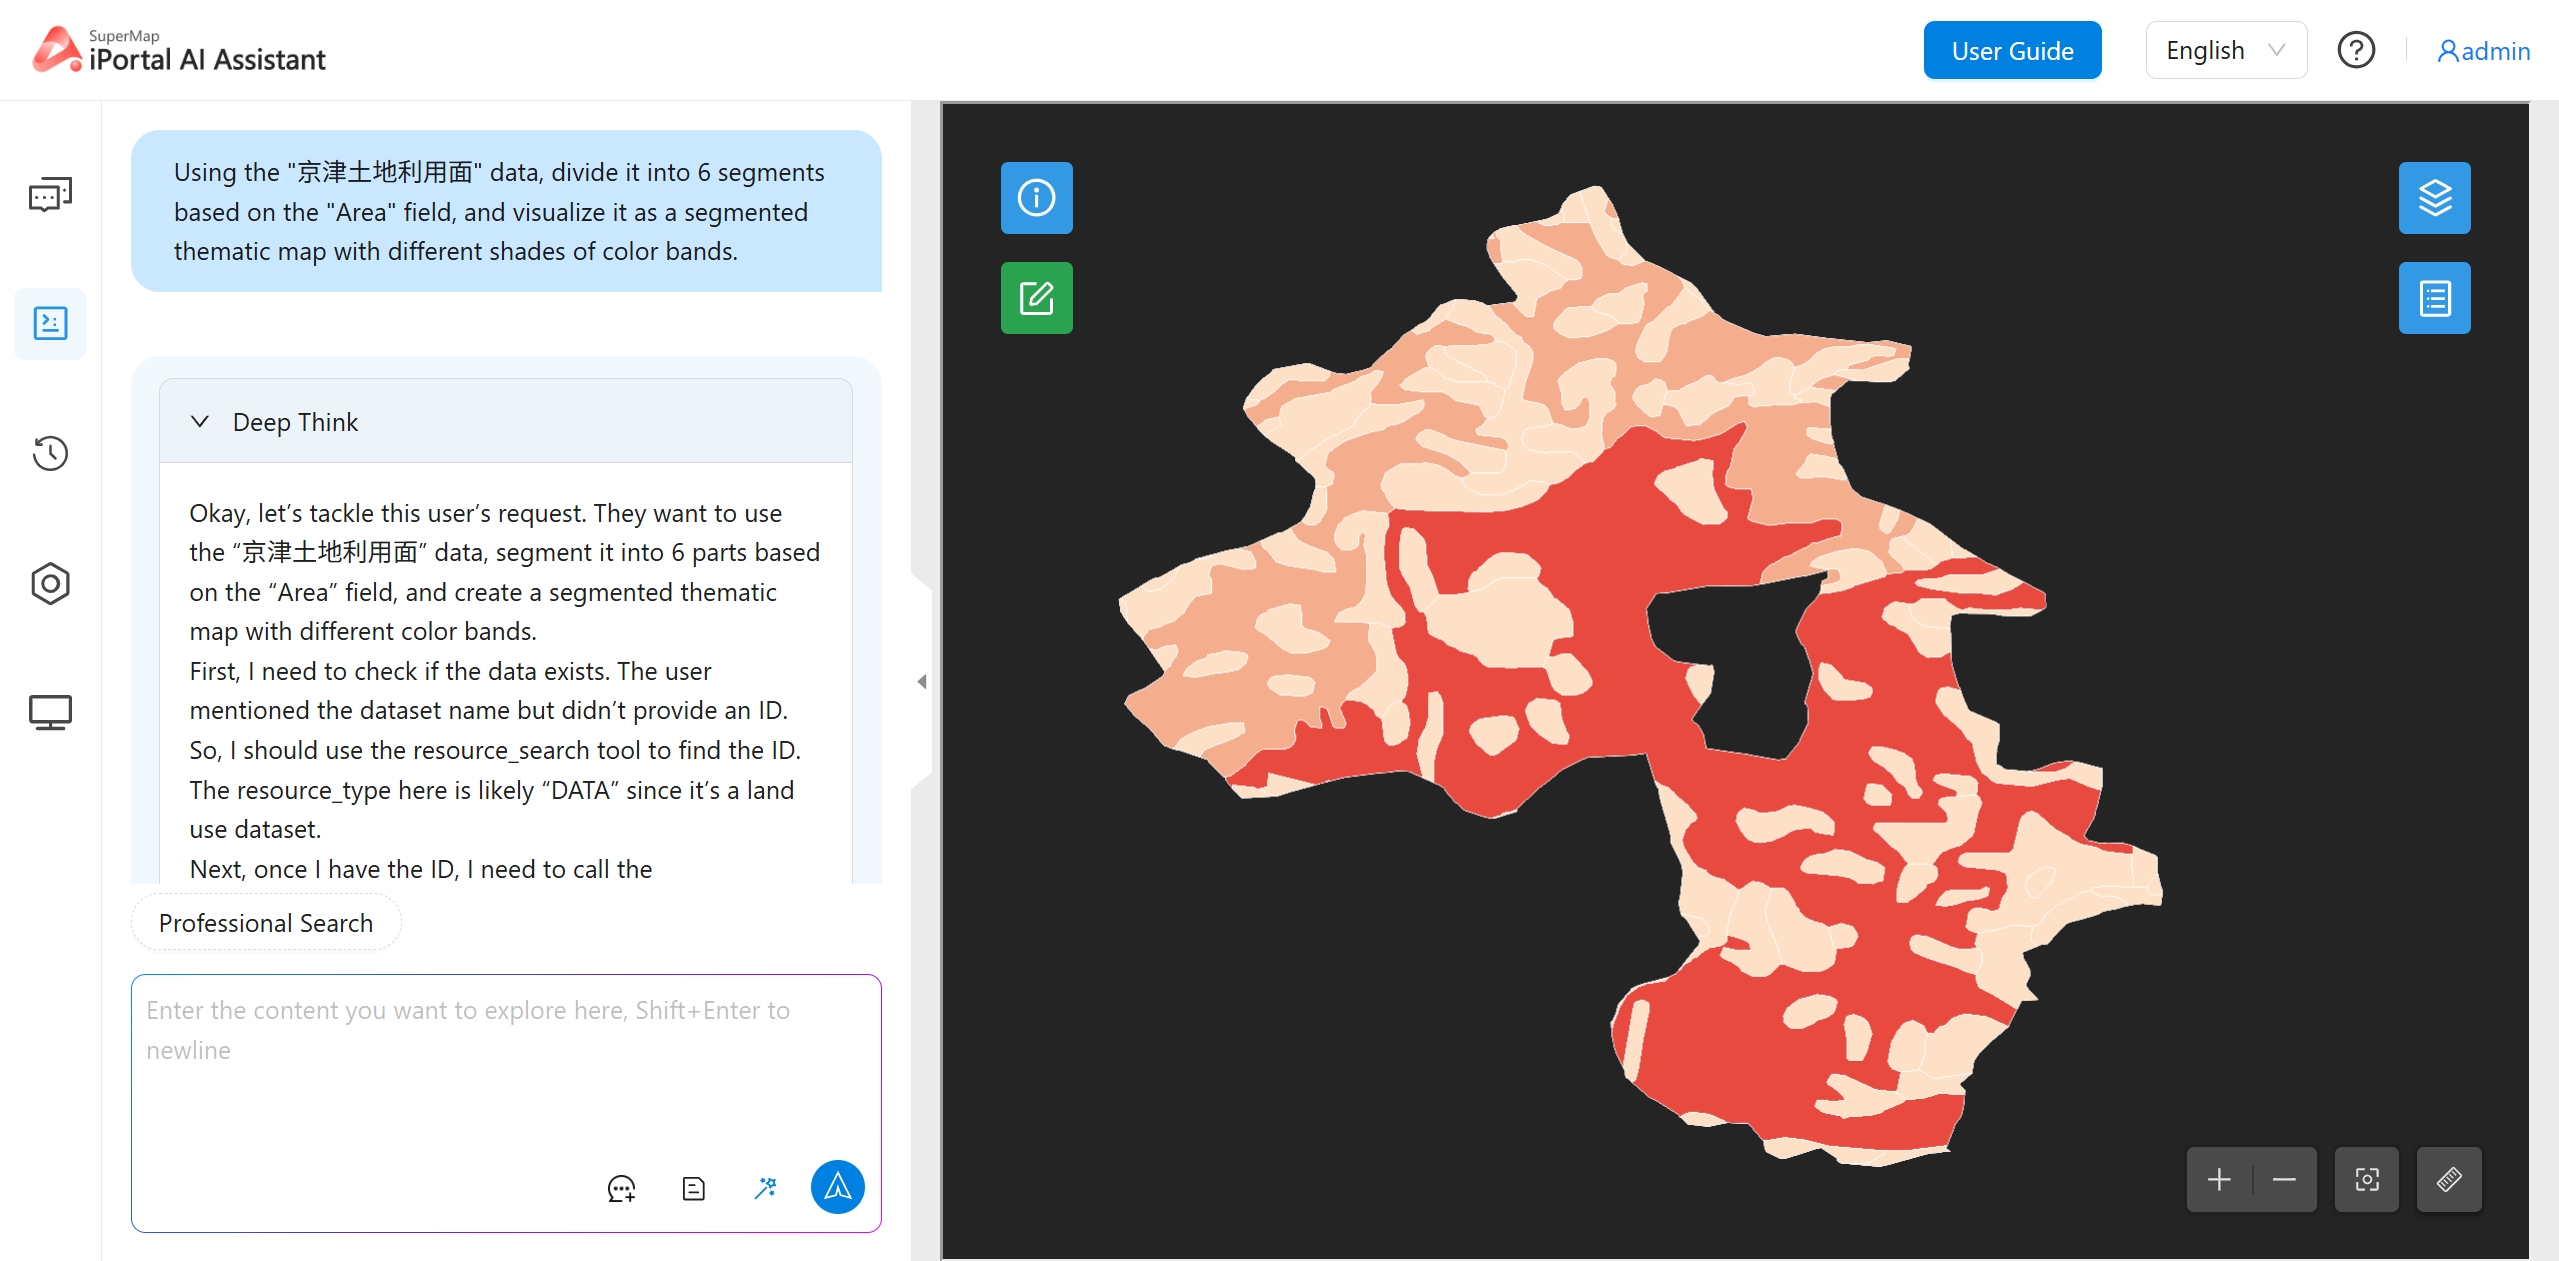 |
| Figure: Segmented Thematic Map Visualization |