Function Description
This function is designed to create aggregate maps for visualizing clustered spatial data patterns within the current resources.
Supported Data Sources
- iPortal Data Resource
Supported Formats: STRUCTUREDDATA
- Uploaded Files (via AI Assistant interface)
Supported formats: CSV, Excel, GeoJSON, Shp (supported data format *.zip), maximum 200MB
1. GeoJSON data stored in JSONL format is not supported for upload;
2. Data must be uploaded via the SuperMap iPortal AI Assistant interface. Uploading directly through SuperMap iPortal may cause tool invocation failure.
Function Entrance
Two methods are available to generate aggregate maps.
Directly Input Aggregate Map Command in the Dialog Box
- Click Dialog on the left panel of the main interface.
Select Aggregate Map Command in "Instruction Center"
- Navigate to Instruction -> Map Visualization Tools on the left panel.
Operation Steps
Directly Input Aggregate Map Command in the Dialog Box
In the dialog box, enter a command such as: "Use the '北京住宅小区分布' dataset to generate an aggregate map for the SmID field with statistical type set to COUNT", then click the Execute button.
Select Aggregate Map Command in "Instruction Center"
Within the "Map Visualization Tools" section, click the Aggregate Map Drawing box. The preset command will populate the dialog automatically. Click Execute to proceed.
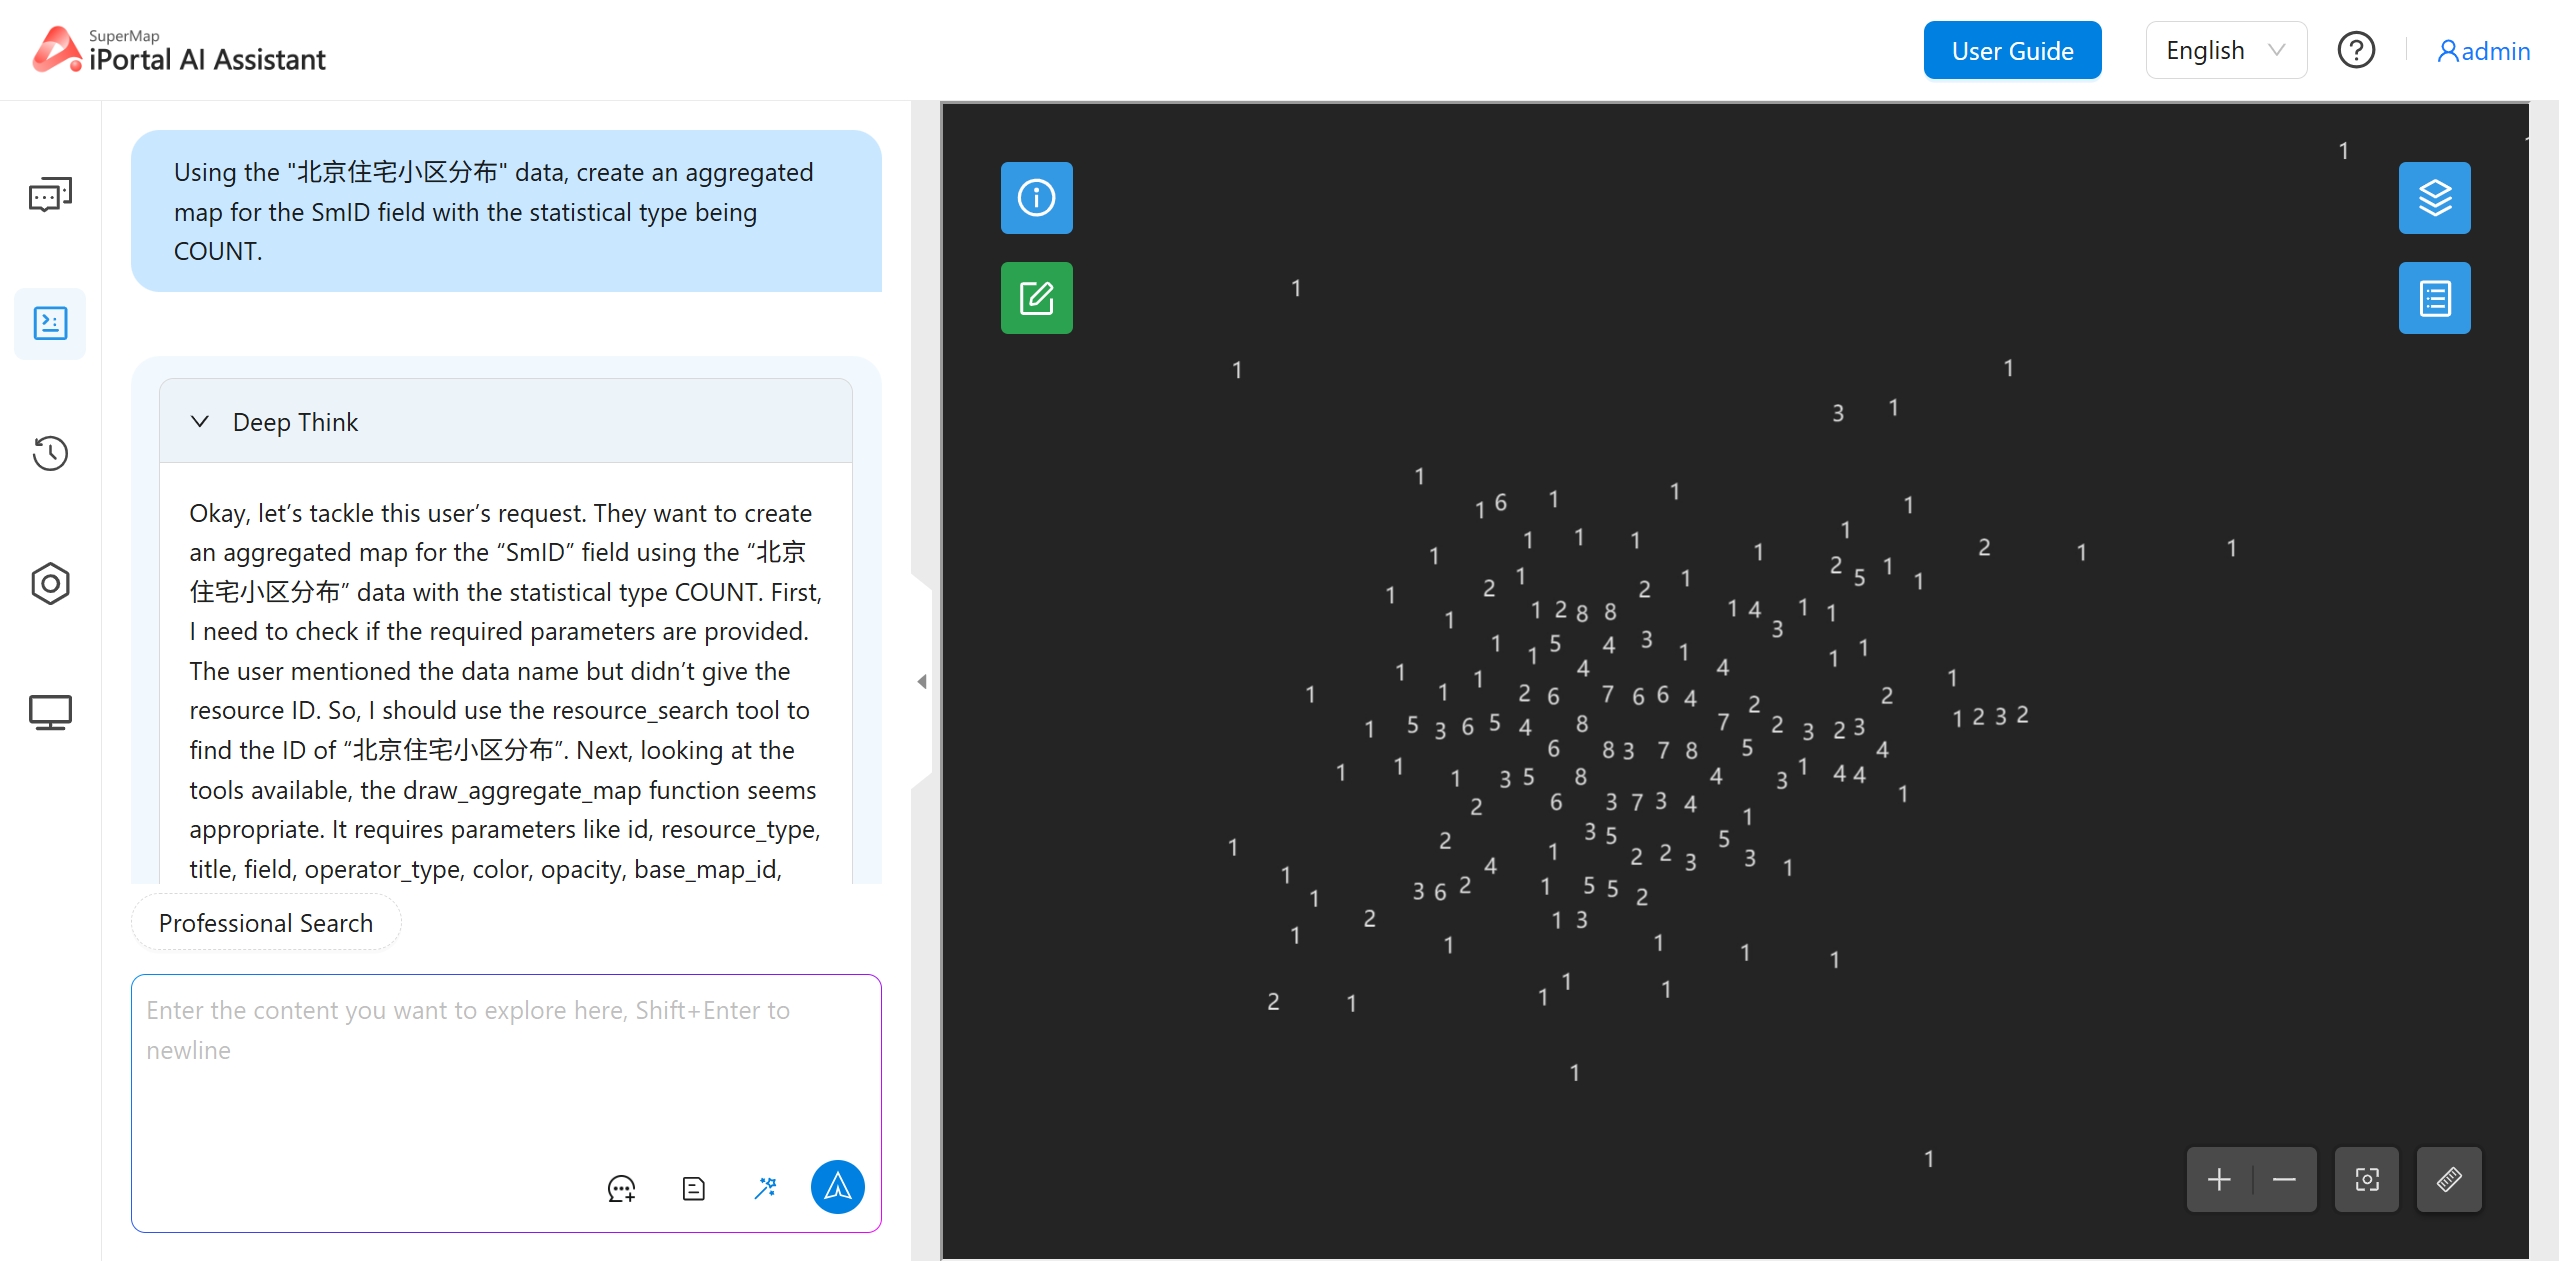 |
| Figure: Aggregate Map Visualization |