Function Description
This function is used to create 3D bar maps for the current data resources.
Supported Data Sources
- iPortal Data Resource
Supported Formats: STRUCTUREDDATA
- Uploaded Files (via AI Assistant interface)
Supported formats: CSV, Excel, GeoJSON, Shp (supported data format *.zip), maximum 200MB
1. GeoJSON data stored in JSONL format is not supported for upload;
2. Data must be uploaded via the SuperMap iPortal AI Assistant interface. Uploading directly through SuperMap iPortal may cause tool invocation failure.
Function Entrance
Function Entrance
There are two ways to perform 3D bar map drawing.
Directly Input 3D Bar Map Command in the Dialog Box
- On the left side of the main interface, click Dialog.
Click 3D Bar Map Command in Instraction Center
- On the left side of the main interface, click Instraction -> Map Visualization Tools.
Operation Steps
Directly Input 3D Bar Map Command in the Dialog Box
In the dialog box, input the 3D bar map command, such as "Use the '北京住宅小区分布' dataset to draw a 3D bar map", then click the Execute button.
Click 3D Bar Map Command in "Commands"
In the "Map Visualization Tools", click the "3D Bar Map Drawing" box. The preset command content will be automatically added to the dialog box. Click the Execute button.
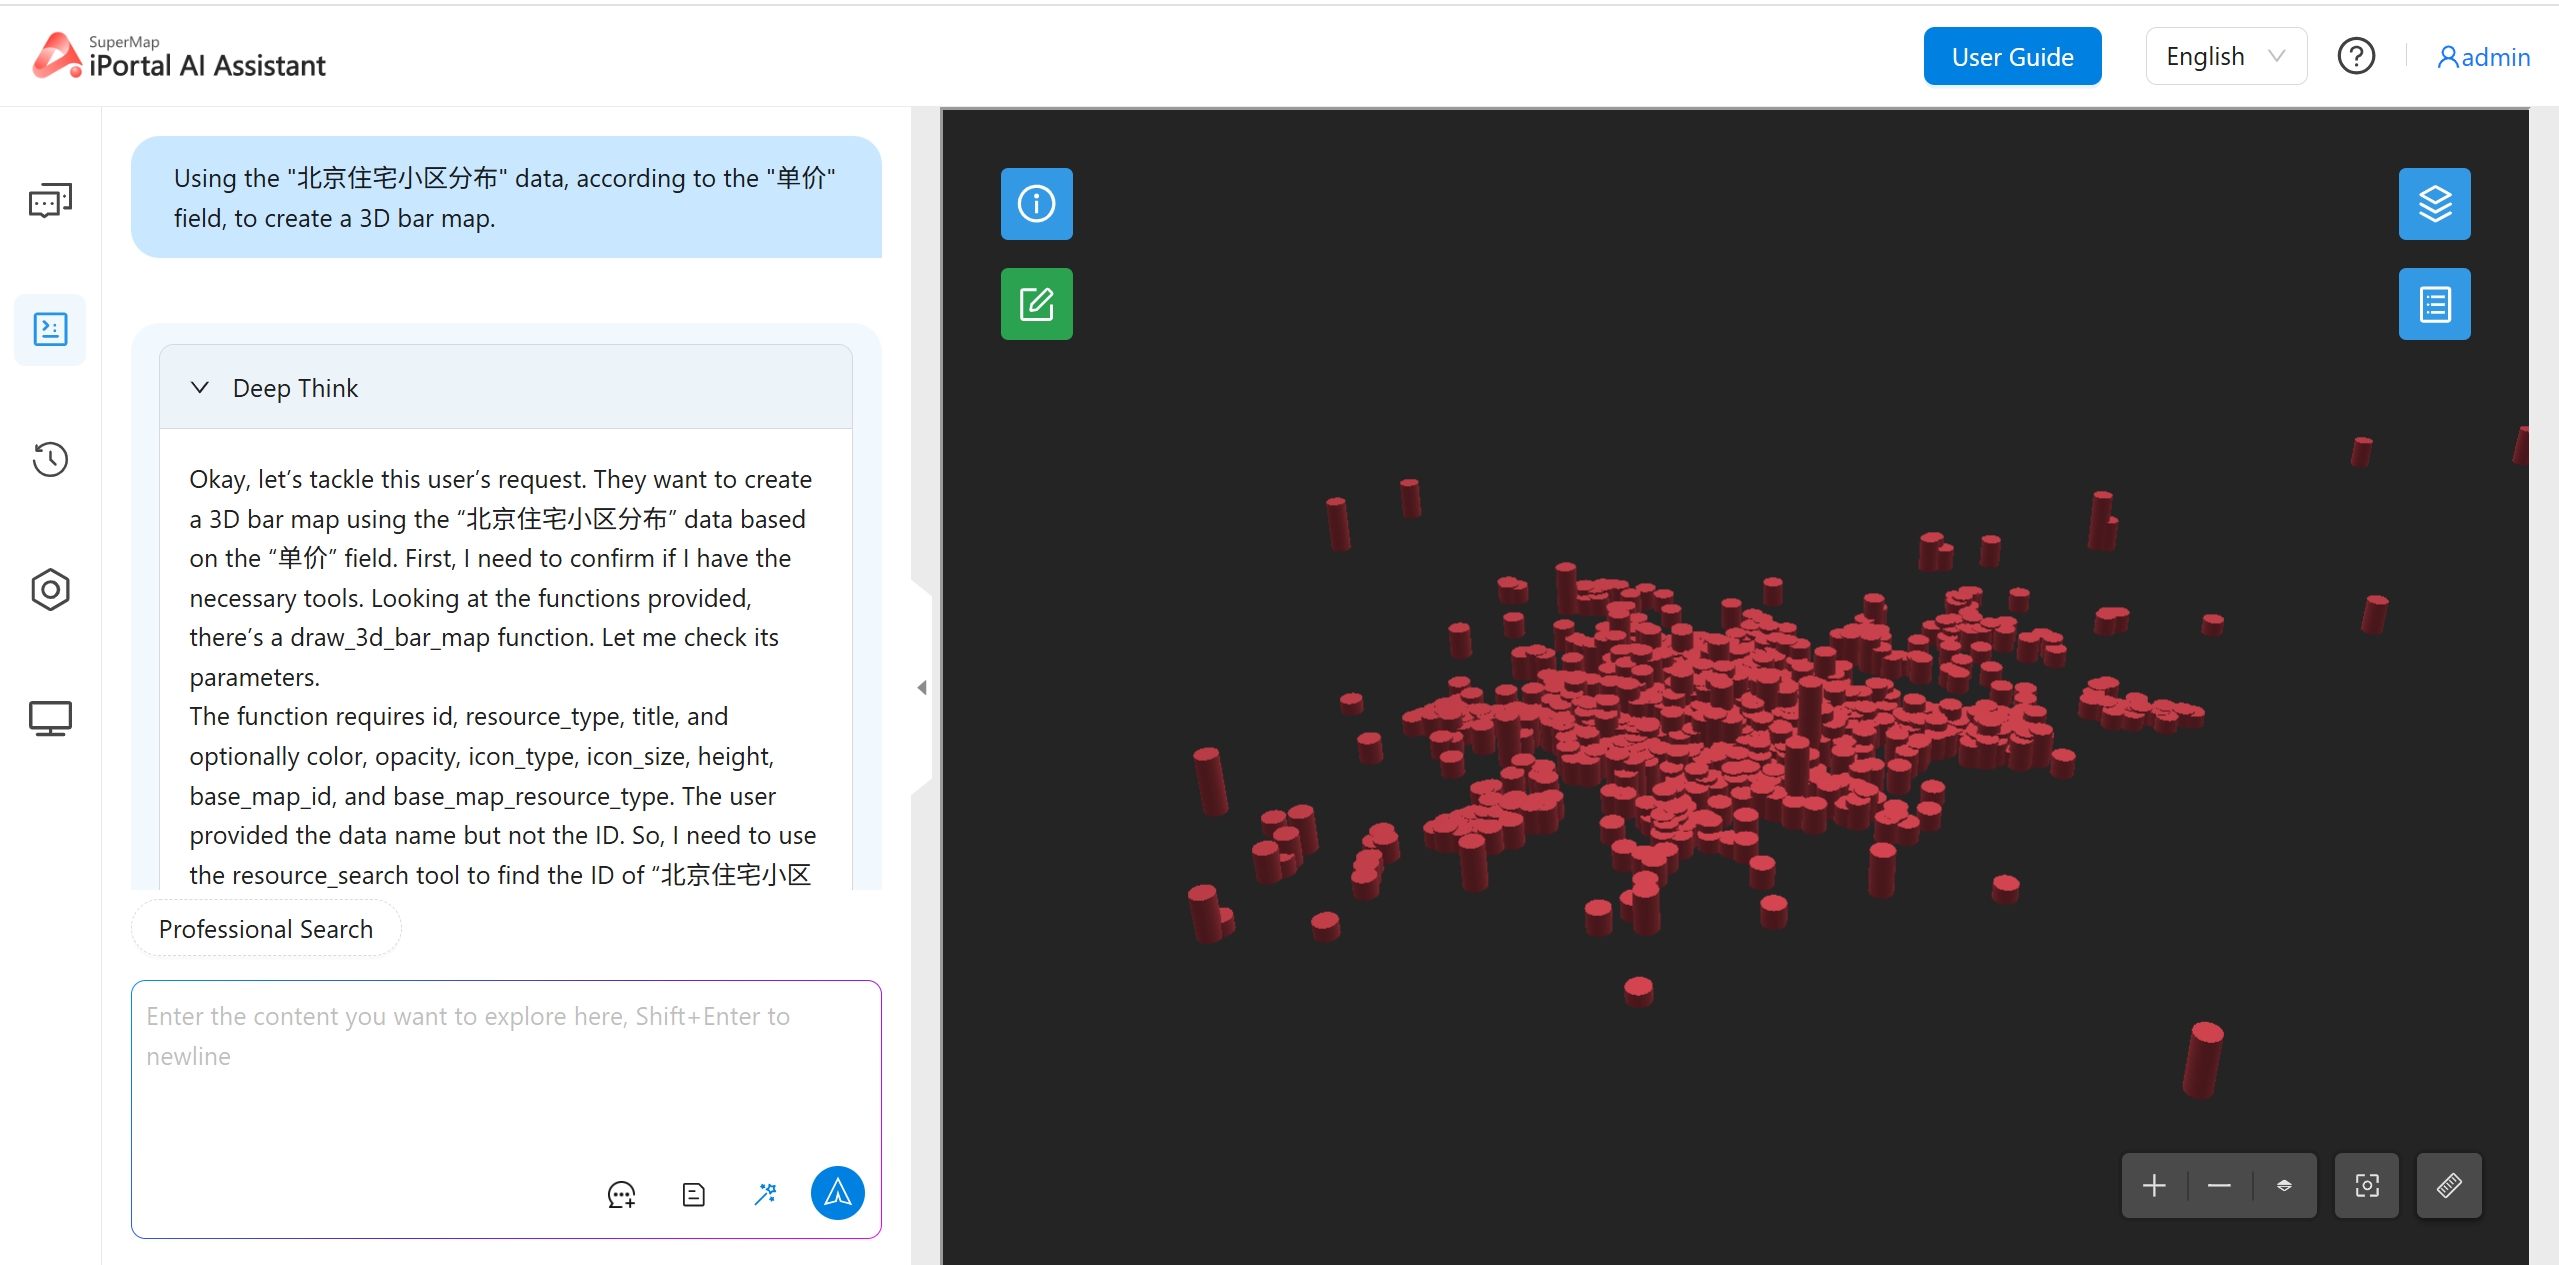 |
| Figure: 3D Bar Map Drawing |