The MapStudio WebApp has access to some processing tools provided by SuperMap iServer, and supports the analysis of the added spatial data to further extract and discover the value of spatial information. Before using the analysis functions in Map Studio, the portal administrator needs to add an iServer and ensure that the server has been extended with the Spatial Analysis Services module.
Summarize with Grid
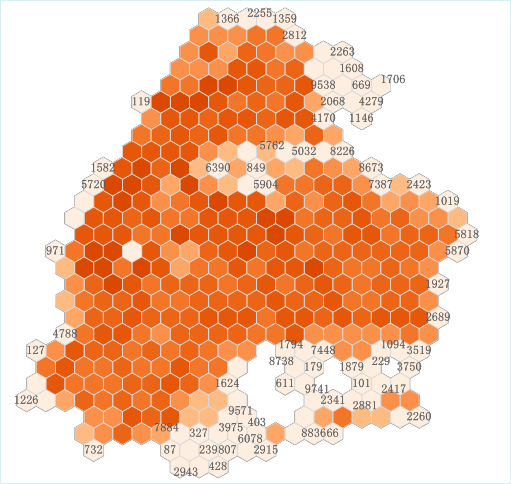
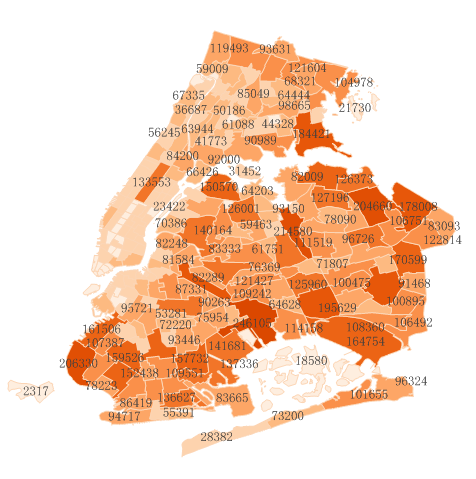
Summarize with Grid refers to the use of regular grids (rectangular or hexagonal) to perform attribute statistics on spatial data. The feature objects to be counted and the regular grid are judged using the intersecting spatial relationship.
Application scenarios
Existing nationwide sales data of a certain brand store, summarize the locations into grids (quadrilaterals, hexagons), and then perform statistical calculation of attributes in each grid, which can count the number of stores and the total sales, maximum sales, etc. An example of a hexagonal grid summary is shown below:
Steps
In MapStudio, the spatial data of point, line and polygon types uploaded through the file supports Summarize with Mesh, including structured data in Resource Center and CSV, Excel, GeoJSON data adding by uploading. The specific operation steps are as follows:
-
Click the "Analysis" tab in the left sidebar, select "Summarize with Grid", and click the "Ok" button;
-
Fill in or select the parameters in turn. The parameter descriptions are as follows:
-
Base dataset: Select the dataset to analyze, supporting datasets of point, line and polygon
-
Grid type: choose a grid shape, support square and hexagonal
-
Grid Size(m): Set the grid size. For square grids, it is the side length of the grid, and for hexagonal grids, it is the distance from the hexagon vertex to the center point.
-
Field: Fields for summarize
-
Operation: Select the attribute statistics method, which supports summation(Sum), minimum value(Min), maximum value(Max), population variance, variance, population standard deviation, standard deviation, record count, and modal value.
-
If you want to add the analysis results to the map immediately after the analysis is complete, you can check "Add analysis results to the map", which is checked by default
-
Once set up, click the "Analysis" button to perform
Summarize with Region
Summarize with Region is to use a dataset to perform Summarize with Region on another dataset, and append the aggregated attribute field values to the source dataset. The summarized dataset can only be polygons, and another dataset can be lines or polygons. Summarize with Region can be used to calculate the number, length or area of objects in the area, and perform attribute statistics.
Application scenarios
- Using the linear high-speed railway data and the administrative boundary polygon data, the total length and average length of the railway in each administrative boundary are counted;
- Use the polygon land use layer and the watershed layer to calculate the land use types with the most types (mode) in each watershed.
Steps
In MapStudio, the spatial data of line and polygon types uploaded through the file supports Summarize with Region, including structured data in Resource Center and CSV, Excel, GeoJSON data adding by uploading. The specific operation steps are as follows:
-
Click the "Analysis" tab in the left sidebar, select "Summarize with Region", and click the "Ok" button;
-
Fill in or select the parameters in turn. The parameter descriptions are as follows:
-
Base dataset: Select summarized dataset, only polygon datasets are supported
-
Summarize dataset: Select the dataset of attributes to be summarized, line and polygon datasets are supported
-
Standard attribute statistics (optional): Select whether to perform attribute statistics based on fusion field values. If you selected Standard attribute statistics, you will also need to select the statistics field and calculation method. Among them, the calculation method supports summation(Sum), maximum value(Max), minimum value(Min), average value, population variance, population standard deviation, standard deviation, variance, modal value, record count
-
Attribute weighted statistics (optional): Choose whether to perform attribute statistics based on the weights of the fusion field values. It should be noted that at least one of attribute weighted statistics and standard attribute statistics must be valid. If you select Attribute weighted statistics, you also need to select the statistics field and calculation method. The supported calculation methods are the same as Standard attribute statistics. When only part of the area of the summarized object is inside the summary object, the area/length ratio in the interior will be used as the weight to perform weighted statistics on the attributes of the summarized object. Summarized objects of line and area types only.
-
Keep attribute records of source feature objects (optional): select whether the result object retains the attribute information of the source dataset, the default is checked
-
Spatial geometry object of the source feature object is preserved (optional): Select whether the result object retains the spatial geometry objects in the source dataset, the default is checked
-
Statistics summarize dataset length/area (optional): Select whether to count the area or length of the objects being summarized. Unchecked by default
-
If you need to display the analysis results on the map, you can check "Add analysis results to the map", which is checked by default
-
Once set up, click on the "Analysis" button to perform Summarize with Region
Overlay Analysis
Overlay Analysis refers to the process of generating a new dataset through a series of collective operations on two datasets under the same spatial reference system.
Application scenarios
By performing Overlay Analysis on the land use layer of the whole map and the administrative division layer of a certain area, the land use distribution of the area can be obtained by statistics.
Operation
- Clip: Extracts a partial set of features from the clipped (source) dataset, and only objects that fall within the polygons of the clipped (overlay) dataset will be output to the resulting dataset.
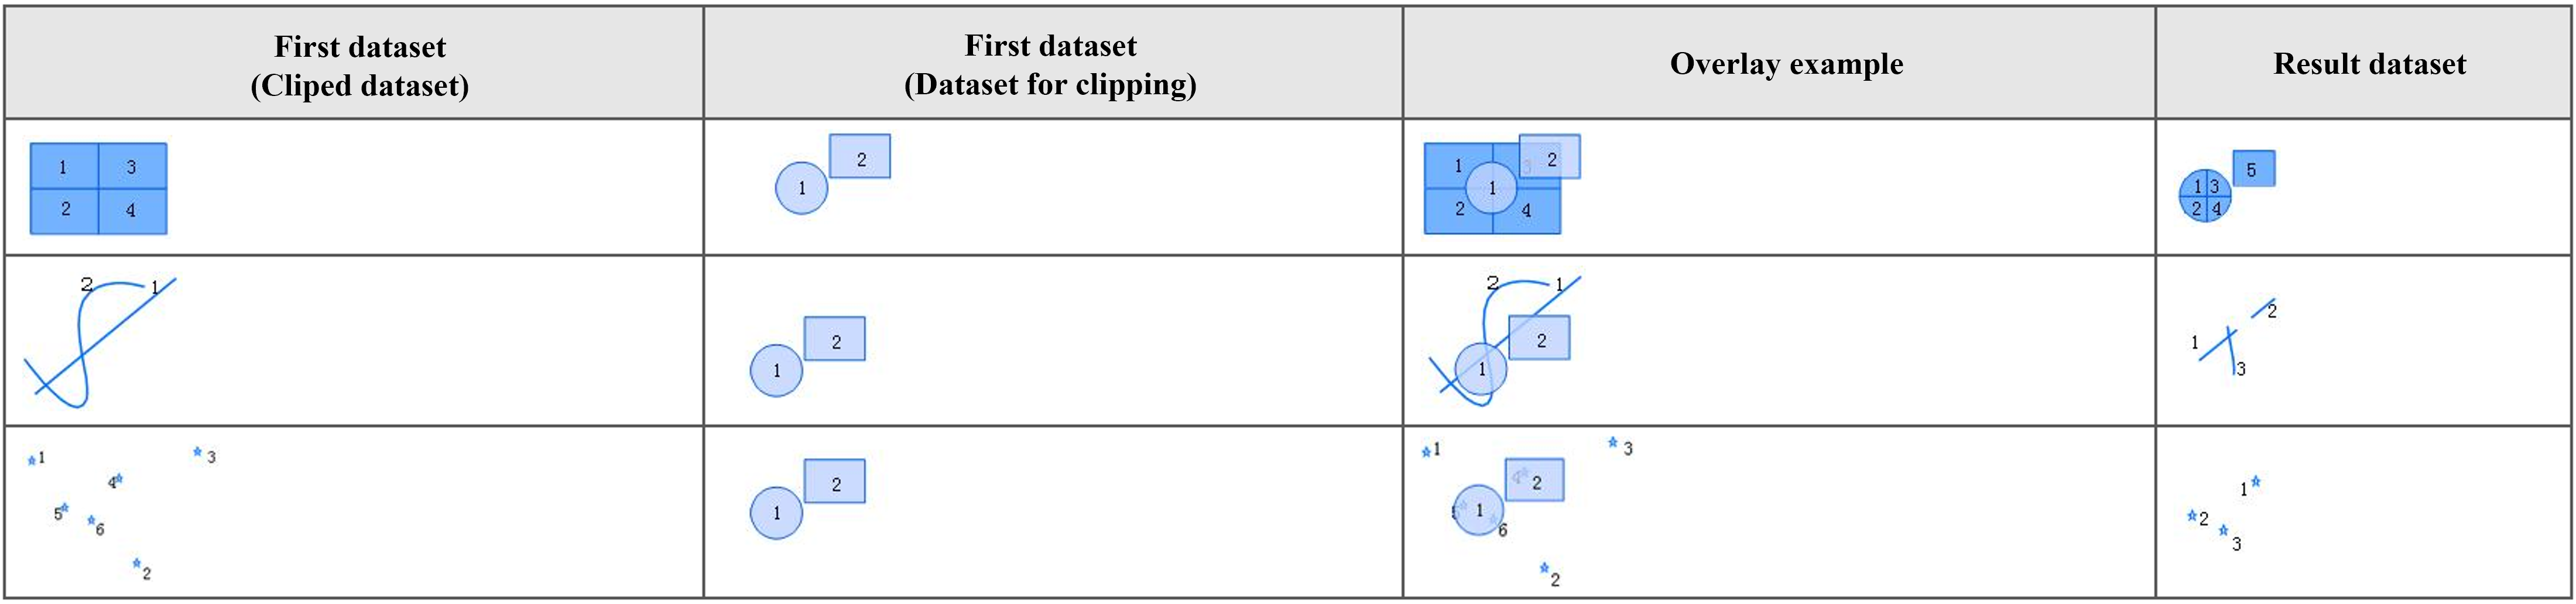
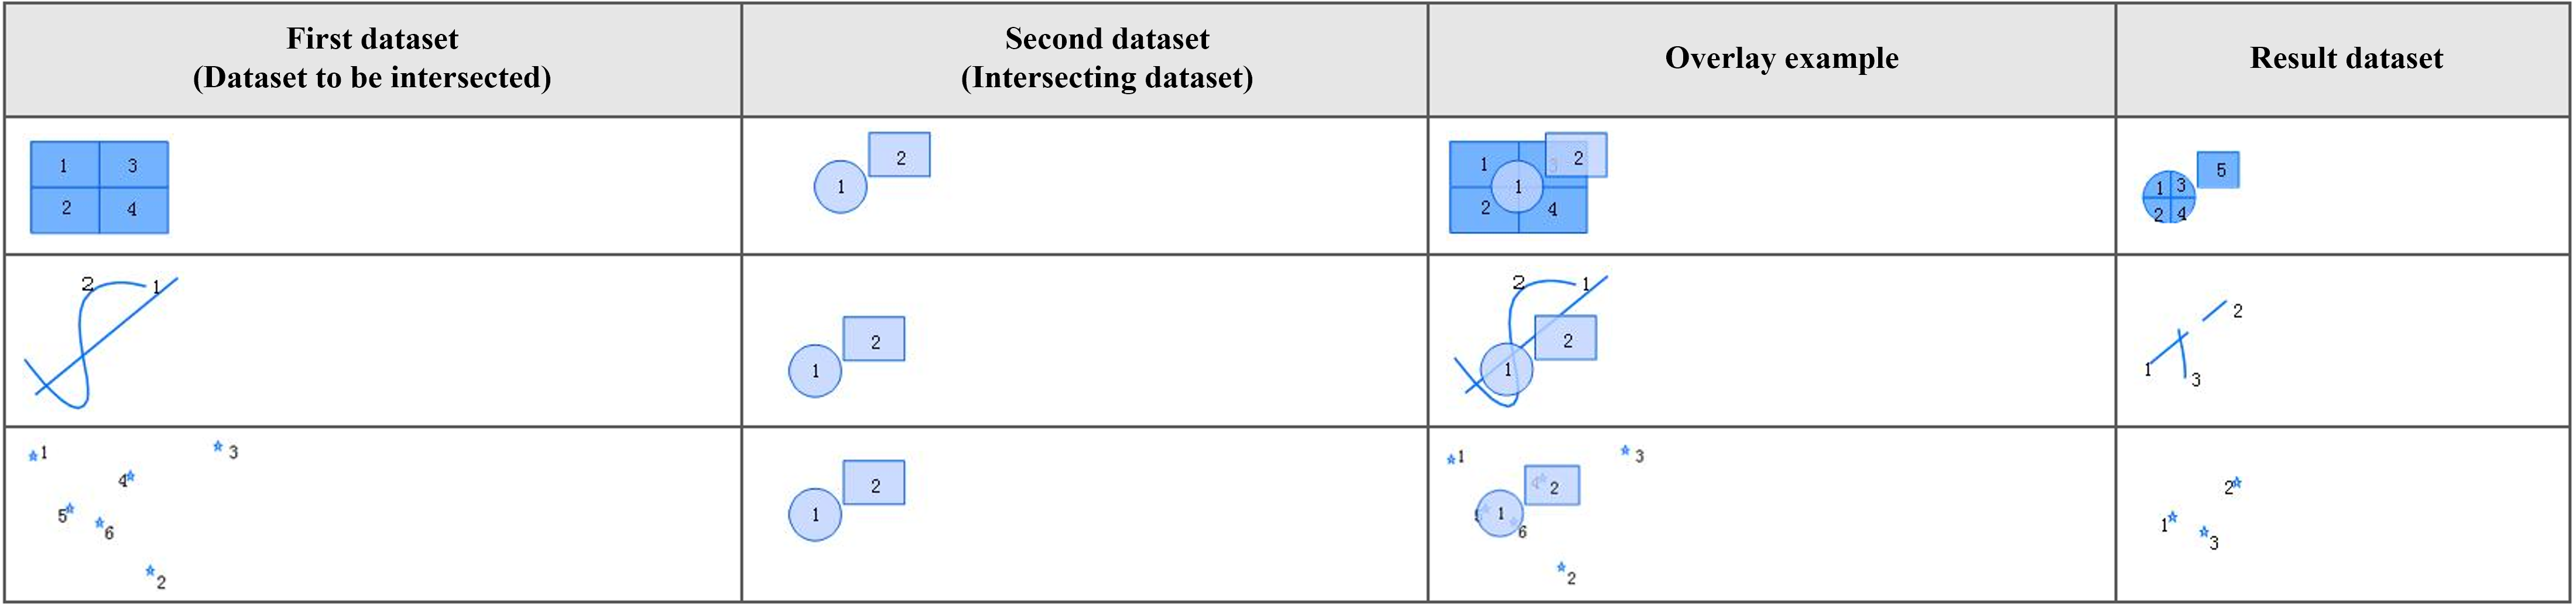
- Intersect: The feature objects of the dataset to be intersected (source) are split at the intersection with the polygons in the intersect (overlay) dataset (except point objects), and the resulting dataset retains the overlapping part of the original two datasets.
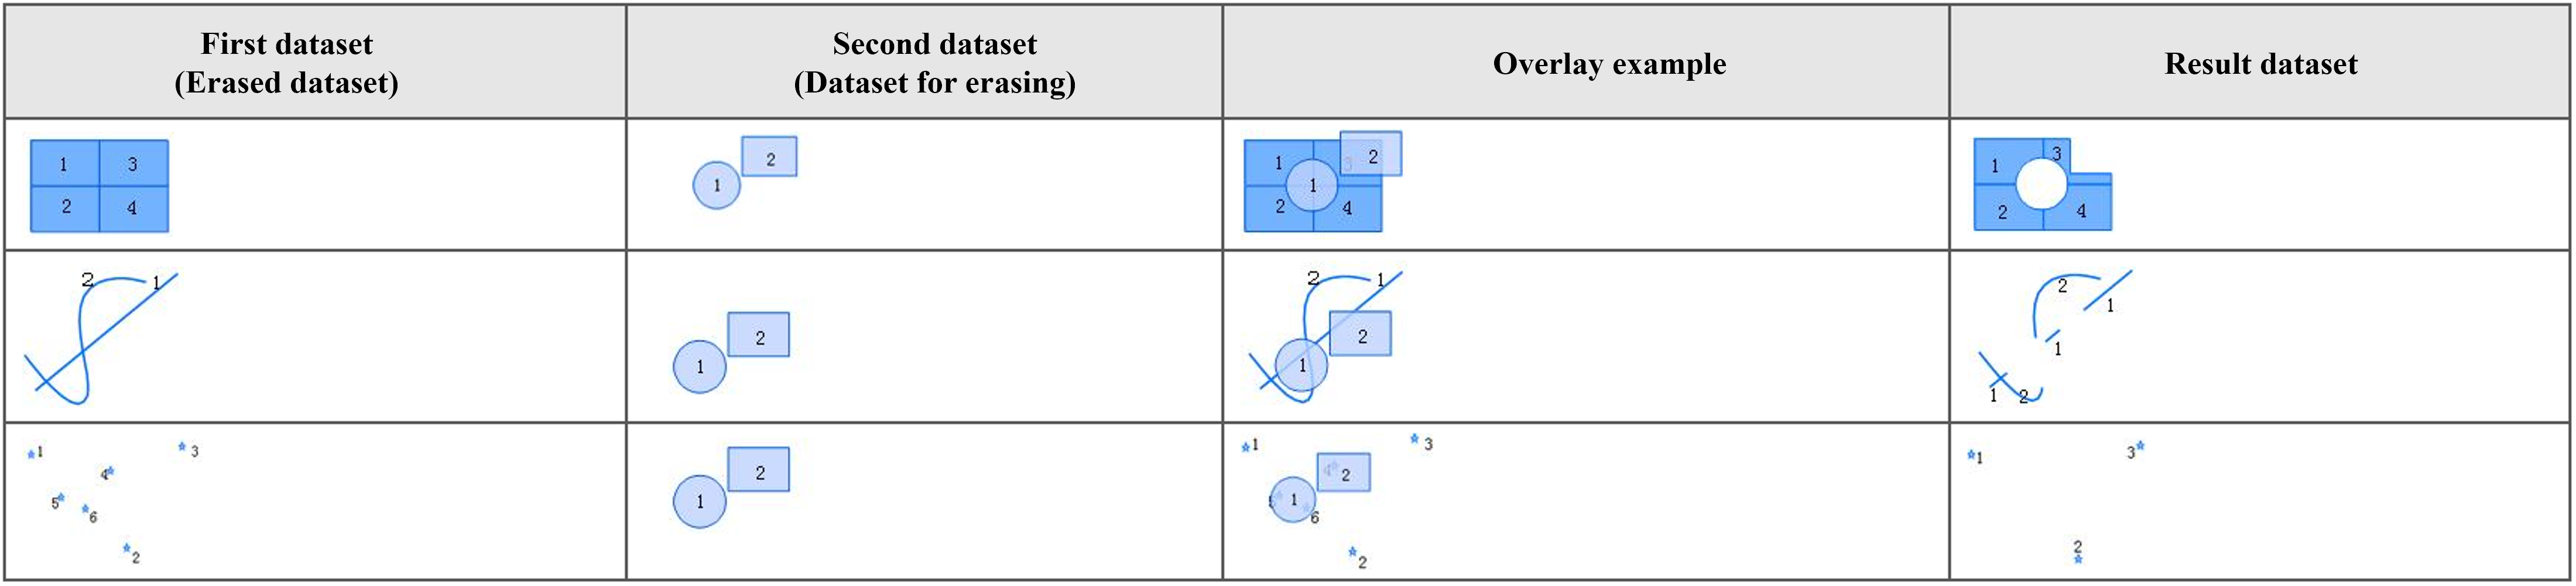
- Erase: The erased dataset (overlay) defines the erased area. All feature elements in the erased dataset (source) that fall within these polygonal areas will be removed, and the feature elements that fall outside the polygonal area will be removed. is reserved, as opposed to the clipping operation.
- Identity: The same operation result layer has the same extent as the first dataset (source), but contains geometry and attribute data from the second dataset (overlay).

- Update: The update operation is to replace the overlapping part with the updated (overlaid) layer with the updated (overlaid) layer, and the resulting dataset retains the geometry and attribute information of the updated dataset.

- XOR: For each polygon object of the overlaid data, remove the part that intersects with the overlay data, and keep the remaining part.

- Union: The union layer retains all layer features of both datasets. After the union operation, the polygons of the two polygon datasets are split at the intersection, and the geometry and attribute information of both datasets are output into the resulting dataset.

Steps
In MapStudio, the spatial data of polint, line and polygon types uploaded through the file supports overlay analysis, including structured data in Resource Center and CSV, Excel, GeoJSON data adding by uploading. The specific operation steps are as follows:
-
Click the "Analysis" tab in the left sidebar, select "Overlay", and click the "Ok" button;
-
Fill in or select each parameter in turn, the parameter description is as follows:
-
Base dataset: Select the dataset to be overlaid, supporting datasets of point, line and polygon
-
Overlay datasets: Select overlay datasets, only polygon datasets are supported
-
Operation: Select the overlay operation, the supported operation include clip, intersect, erase, identity, update, XOR, and union
-
Tolerance: Node Tolerance. The default value is 0.0. When the tolerance is less than 1.0e-10, a node tolerance of 1.0e-7 will be used if the coordinate system of the dataset is a geographic coordinate system, and a node tolerance of 1.0e-2 will be used when the coordinate system is empty or projected.
-
Source fields (optional): The set of field names that need to be reserved in the overlaid dataset
-
is return single geometry (optional): Select whether to return a single geometric object, the default is checked. When the line and polygon are clipped, intersected and identity, if the line is within multiple polygon objects (polygon objects overlap) or at the boundary, return a line object or return multiple line objects, that is, if checked, return a line object, if unchecked, multiple independent line objects are returned
-
is iniProcess (optional): Select whether to perform topology preprocessing, the default is checked, and it is only valid for the source dataset that is a polygon type
-
If you need to display the analysis results on the map, you can check "Add analysis results to the map", which is checked by default
-
Once set up, click the "Analysis" button to perform an Overlay Analysis