Click Tools in the left navigation bar to bring up a list of tools, including Layer Manipulation, Roaming, Add Objects and Markup. Among them, the "Layer Operation" tool can perform excavation and flattening operations on the tilt photography 3D model data and TIN terrain data; the "Roaming" tool can browse the models in the project according to the specified path; the "Add Object" tool can add subsidiary models in the project to simulate the features in the scene. The "Add Objects" tool can add subsidiary models to the project to simulate the features in the scene, such as airplanes, cars, etc. The "Labeling" tool supports adding labels and descriptions to the models in the project.
Layer operation
Tilt operation
Select layer
- Click Basemap->Add Basemap->Custom Layer->s3m Layer and select the basemap data to be added to load into the project. The layer to be operated in the currently loaded tilt photography data will be automatically recognized and displayed in the Select Layer drop-down list in the tilt operation tab.
Operation type
- Operation type selected for the excavation, click OK, the mouse becomes a "brush" style in the viewport target location to draw the excavation range surface, drawing is completed after the viewport tilt operation layer will show the effect of excavation. Select the flattening operation, the mouse becomes "brush" style in the flattening position to draw the flattening range of surfaces, click OK, in the viewport layer will show the effect of flattening.
Delete
-
Click Delete and the results of the excavation or flattening operation will be cleared in the viewport layer.
Terrain operation
Operation type
- Select excavation, click OK, the mouse will change to "brush" style and then draw the excavation range surface at the location where you want to excavate, the terrain layer will show the effect after excavation. Select Modify Operation, click OK, the mouse will change to "brush" style and then draw the flattening range surface at the location where you want to modify the terrain, and the effect of flattening will be shown on the terrain layer in the viewport.
Excavation depth
- Here you can set the width of the terrain excavation, which can be controlled by entering a number or clicking on "+" or "-".
Clear
- Click clear will clear the terrain excavation or modification results in the viewport.
Roaming
Route Setting
Set a route in the scene along which the camera will play back the features in the scene when roaming is performed. Route settings can be used to specify a roaming path for the scene by creating and importing a new route.
New
Select the New tab, and then click the Draw button, the mouse becomes a "paintbrush" style, move to the scene, click the mouse to start drawing, along the path you want to navigate to draw the line, after the completion of the drawing, click the right mouse button to end the drawing. In the panel of the "Path Settings" will generate the corresponding records of the drawing route, you can "control the hidden" and other operations.
Route Grounding
When you create a new roaming route, if you check the "Route to ground" checkbox, the line data will be drawn to the ground, i.e., the relative ground elevation will be zero; if you don't check the "Route to ground" checkbox, the line data will be kept at the same elevation as when it was drawn.
Import
Select the Import tab, click the button next to Import Route, select the json file of the route in the pop-up "Open" file selection dialog, select it and click Open, the selected route will be added to the current scene and the corresponding path of the opened route will be added to the "Path Settings" in the panel. The selected route will be added to the current scene and the corresponding record of the opened route will be added in the "Path Settings" panel, and you can do the operations such as "Control Hiding and Showing" on it.
Route Editing
You can edit the new or imported route in the route list box as follows:
Select
Check the "Select" checkbox to set the roaming parameters such as model setting, view mode and roaming speed for the current route.
Hide
Click the Hide button to control whether the current line layer is displayed in the scene.
Operation
- Rename: click the action button, click Rename in the action list, the "Route" in the list will become editable, key in the new name and then press enter or click any blank position to complete the renaming of the current route.
- Export: Click the Operation button, click Export in the operation list, you can download the current route data as a json file. The json file can also be imported and re-added to the current roaming scene.
- Position: Click the Action button, select Position in the Action list, the camera will position to the data range of the current route.
- Delete: Click the Action button and click Delete in the action list, you can delete the current route.
Model Setting
Specify a model for the set roaming path. When roaming, the scene will display the effect of the specified model traveling along the roaming path. For example, if you set a car model, the car will be shown running in the environment when roaming. You can use the built-in default model or add an external model by customizing the model.
Default
Selecting Default in the Model setting means that the built-in model of iDesigner3D will be used for the roaming effect.
Customize
Custom model supports *.gltf format. Select Custom in the Model Settings, click the File icon next to the model address, and then select the model file you want to add in the pop-up Open File Selection dialog box, and then click Open to complete the custom model settings.
Model Scaling
Support to adjust the scale of the model, the value range is 0~10, you can adjust the model size by dragging the "strip" next to the model scale.
Show Model
Controls whether the model is displayed in the scene. Check the "Show Model" checkbox to show the model during scene roaming; uncheck the "Show Model" checkbox to not show the model during scene roaming.
View Settings
You can control the effect of scene roaming by setting parameters such as view mode, roaming speed and playback animation.
Viewpoint Mode
Set the position of the camera when roaming, supporting four modes: None, Follow View, First View and God View. The specific meanings are as follows:
- None: no camera viewpoint.
- Follow View: The model takes the set roaming route as the traveling direction, the camera follows the model movement, the camera position is not fixed, you can hold down the left mouse button and drag and drop to adjust the camera view direction.
- First View: The model takes the set roaming route as the traveling direction, and the camera follows the model in the front view position.
- God View: The model takes the set roaming route as the traveling direction, and the camera follows the model in top view posture.
Perspective Shift
When the view mode is set to "First View" and "God View", you can adjust the camera position by setting the camera view offset. Based on the model, you can set the distance in x,y,z direction of the camera's viewpoint offset in meters.
Roaming Speed
The speed of camera movement, unit is m/s, you can input the number or click "+" or "-" to control the speed.
Smooth Route
Smooth route can increase the continuity of the camera along the model, more in line with the characteristics of the movement of the features. For example, when the "Smooth Route" checkbox is checked, the camera view switching process will be smoother at the corner of the zigzag path.
Animation
- Start: Click the Start button to start the roaming animation.
- Pause: Clicking the Pause button pauses playback at the current position, clicking the Start button again resumes playback at the current position.
- Stop: Clicking the Stop button stops playback, clicking the Start button again will start playback from the initial position.
Add Objects
iDesigner3D supports adding common model objects to the scene to simulate the real environment. iDesigner3D has some built-in model objects, such as buses, cars, and airplanes, which can be added directly; you can also add external model objects by customizing them.
Model Settings
Default
Select Default as the model setting, select the model you want to add in the panel, move the mouse to the scene, and then click the mouse at the target position of the scene after the mouse becomes "cross" style. The model is in the editing state when it is added to the scene, and you can adjust the spatial position and size of the model by dragging and dropping the indicator lines around the model's surface, and then click on any blank position when you are done.
Customized
Custom models support *.s3m and *.s3mb formats. Select the model setting as Custom, click the "File" icon button next to the model address, select the model file to be added in the pop-up "Open" file selection dialog box, select it and click Open. Then enter the name of the model in the model name input box, click the Add button, move the mouse to the scene, the mouse becomes a "cross" style in the scene after the target position can be clicked on the mouse. When the model is added to the scene, it is in the editing state, you can drag and drop the indicator lines around the surface of the model to adjust its spatial position and size, after editing, click any blank position to finish adding the model.
Model Editing
Adjusting the spatial position and size of the model is supported when the model is in the editing state. There are two ways you can edit a model: either you can edit the model while adding objects, or you can edit the model after adding objects by clicking the "Browse" icon in the Side Tools to switch it to the "Selected for Editing" icon and selecting the model in the scene. After adding the model, click the "Browse" icon in the side tool to switch it to the "Selected for Editing" icon and select the model in the scene. As shown in the figure below, the red, green and blue lines around the surface of the model indicate that the model is in the editable state, and you can adjust the size, position and direction of the model by dragging and dropping the model with the corresponding lines selected (when the lines are in white color, it means that the lines are selected).
The meanings of the indicator lines are as follows:
(1) Different colors of lines have different meanings, among them, red line means editing the model in X-axis direction, green line means editing the model in Y-axis direction, and blue line means editing the model in Z-axis direction;
(2) Lines of different styles have different meanings, among which straight lines with arrows are used to adjust the distance of model displacement in that direction, straight lines with square dots are used to adjust the size of model scaling in that direction, and circular curves are used to adjust the angle of model rotation in that direction. In the model editing state, you can adjust the model to your desired state by matching the lines.
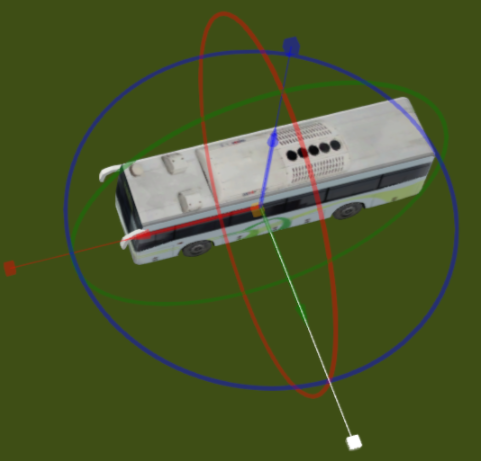
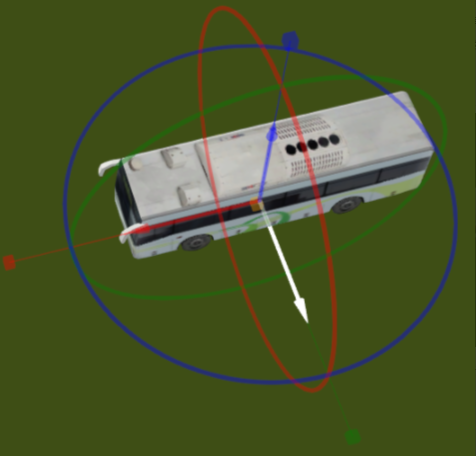
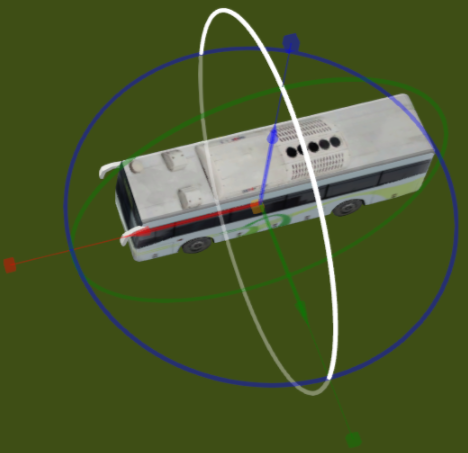
Adjust Size Adjust Distance Adjust Direction
Marker Labeling
Supports adding elements such as markers and labels to identify features in the scene.
Landmarking
Marks the features in the scene with icons and text. First, set the icon style and text label style of the landmark, then click the Add button, move the mouse to the scene, and then click the mouse at the target position to add a landmark for the feature after the mouse changes to the "cross" style. The parameters of the landmark are set as follows:
Icon name
The name of the marked feature.
Icon style
Click to select an icon style for the tagged feature.
Format
- Show Icon: control whether to show the icon part of the landmark. By default, when the "Show Icon" checkbox is checked, the landmark will show both "icon" and "text"; if it is unchecked, only text will be shown.
- Icon Zoom: You can adjust the size of the icon by dragging the "scroll bar" left or right, the value range is 0~2.
- Icon Offset: the icon is centered under the text label by default, you can adjust the position of the icon relative to the text by setting the distance of the icon's displacement in horizontal and vertical directions. Support inputting numbers or clicking "+" or "-" to control the offset distance.
- Show Text: control whether the text part of the landmark is shown or not. Default is checked, when the "Show Text" checkbox is checked, the icon will show both icon and text; if it is unchecked, only the icon part will be shown.
- Text Size: the text size of the icon name, support inputting numbers or clicking "+" or "-" to control the text size.
- Text Offset: The text is centered above the icon by default, you can adjust the position of the text relative to the icon by setting the distance of the text displacement in horizontal and vertical direction. Support inputting numbers or clicking "+" or "-" to change the offset distance.
- Text Color: The text color of the icon name. Click "Ribbon" next to the text color to set the color in the popup color panel by inputting RGB value, or you can pick up the color by clicking the color map.
- Outline width: the width of the text outline. You can input numbers or click "+" or "-" to change the width value.
- Outline Color: The color of the text outline. Click "Ribbon" next to Outline Color to set the color by inputting RGB value in the popup color panel, or you can pick up the color by clicking the color map.
Description
You can enter a paragraph to add a description to the landmark.
Tags
Label the features in the scene. First of all, set the label lead style and text style and other information, and then click the Add button, move the mouse to the scene, the mouse becomes a "cross" style in the target position after clicking the mouse to add a label for the feature. The parameters of the label are set as follows:
Label Name
The name of the tagged feature.
Label Style
Click to select a tag's lead style.
Format
- Text Size: the text size of the label name, support entering numbers or clicking "+" or "-" to control the text size.
- Text Color: the text color of the label name. Click "Ribbon" next to the text color to set the color by inputting RGB value in the popup color panel, or you can click the color map to pick up the color.
- Outline Width: the width of the text outline. You can input numbers or click "+" or "-" to change the width value.
- Outline Color: The color of the text outline. Click "Ribbon" next to Outline Color to set the color in the popup color panel by inputting RGB value, or you can pick up the color by clicking the color map.
- Show Background: the label consists of lead + text + solid color rectangle background, Show Background controls whether the text background of the label is shown or not. Default check box, when the "Show Background" check box is checked, the text part of the label has a background; unchecked is no background.
- Show Leads: controls whether the "Leads" part of the label is shown. Default check box, when the "Show Leads" check box is checked, the label shows leads; unchecked, no leads.
- Lead Color: The color of the lead part of the label. Click "Ribbon" next to Lead Color to set the color in the popup color panel by inputting RGB value, or you can also pick up the color by clicking the color map.
Description
You can enter a piece of text to add a description to the landmark.
Draw Lines
You can add feature lines to the scene. First, set the line style and other information, then click the Add button, move the mouse to the scene, the mouse changes to the "brush" style and moves to the scene, click the mouse to start drawing, draw the line along the path you want to browse, click the right mouse button to end the drawing.
Line Name
The name of the line to draw.
Line Style
Six line styles are supported: solid, interval, outline, arrow, halo, and dynamic.
Format
- Height Modes: Four height modes are provided for the display of line data, namely, elevation, close to surface, stick to S3M model and stick to ground stick to S3M model. Among them, elevation indicates the actual height of the line data plotted, which is the elevation relative to the sea level; close to the surface indicates that the elevation of the line data is ignored and the line data is attached to the surface according to the undulation state of the terrain surface, i.e., the height relative to the surface of the terrain is zero; S3M model indicates that the line data is completely attached to the model along with the model's undulation, i.e., the height relative to the model data is zero; and the ground-post S3M model indicates that the line data is attached to the ground surface and the model, i.e., the height relative to the model data is zero. model indicates that the line data is attached to the ground surface and to the S3M model.
- Line Color: The color of the line to be drawn. Click "Ribbon" next to the line color to set the color by inputting the RGB value in the popup color panel, or you can click the color map to pick up the color.
- Line Width: the width of the line to be drawn. You can enter a number or click "+" or "-" to change the width value.
- Interval Color: When "Interval Line" is selected as the line style, you can set the color of the interval part of the interval line. Click "Ribbon" next to Interval Color to set the color in the popup color panel by inputting RGB value, or you can click the color map to pick up the color.
- Interval Width: When "Interval Line" is selected as the line style, you can set the width of the interval part of the interval line. You can change the width by entering a number or clicking "+" or "-".
- Outline Color: You can set the color of the outline of the line when "Outline" and "Dynamic Line" are selected as the line style. Click "Ribbon" next to Outline Color to set the color by entering the RGB value in the popup color panel, or you can pick up the color by clicking the color map.
- Outline Width: When "Outline" and "Dynamic Line" are selected as the line style, you can set the width of the line outline. Enter a number or click "+" or "-" to change the width value.
Description
You can enter a text to add a description to the line object.
Draw surface
Face Name
The name of the face to draw.
Face Style
Select a style for the face to be drawn, available in solid color, grid, and stripe.
Format
- Height Modes: Four height modes are provided for the display of line data, namely, elevation, close to surface, stick to S3M model and stick to ground stick to S3M model. Among them, elevation indicates the actual height of the line data plotted, which is the elevation relative to the sea level; close to the surface indicates that the elevation of the line data is ignored and the line data is attached to the surface according to the undulation state of the terrain surface, i.e., the height relative to the surface of the terrain is zero; S3M model indicates that the line data is completely attached to the model along with the model's undulation, i.e., the height relative to the model data is zero; and the ground-post S3M model indicates that the line data is attached to the ground surface and the model, i.e., the height relative to the model data is zero. model indicates that the line data is attached to the ground surface and the S3M model.
- Face Color: The color of the face to be drawn. Click "Ribbon" next to Face Color to set the color by inputting RGB value in the popup color panel, or you can click the color map to pick up the color.
- Grid Color: When "Grid" is selected as the face style, you can set the color of the grid lines in the grid face. Click "Ribbon" next to Grid Color to set the color in the popup color panel by inputting RGB value, or you can pick up the color by clicking the color map.
- Total Grid: When "Grid" is selected as the face style, you can set the number of horizontal and vertical lines that form the grid in the grid face. You can change the number of stripes by entering a number or clicking "+" or "-".
- Line Width: When "Grid" is selected as the face style, you can set the width of the grid lines in the grid face. You can change the width of the grid lines by entering a number or clicking "+" or "-".
- Transparency: When "Grid" is selected for Face Style, the transparency of the grid face can be set.
- Odd Color: When "Stripe" is selected for Face Style, you can set the color of the base stripes in the stripe face. Click "Ribbon" next to Odd Color to set the color by inputting RGB value in the popup color panel, or you can click the color map to pick up the color.
- Even Color: When "Stripe" is selected as the face style, you can set the color of even number of stripes in the stripe face. Click "Ribbon" next to "Even Color" to set the color by inputting RGB value in the popup color panel, or you can pick up the color by clicking the color map.
- Repeat Count: When "Stripe" is selected as the face style, you can set the number of stripes in the stripe face. You can change the number of stripes by entering a number or clicking "+" or "-".
Description
You can enter a text to add a description for this face object.