专题图(themedemo)
范例简介
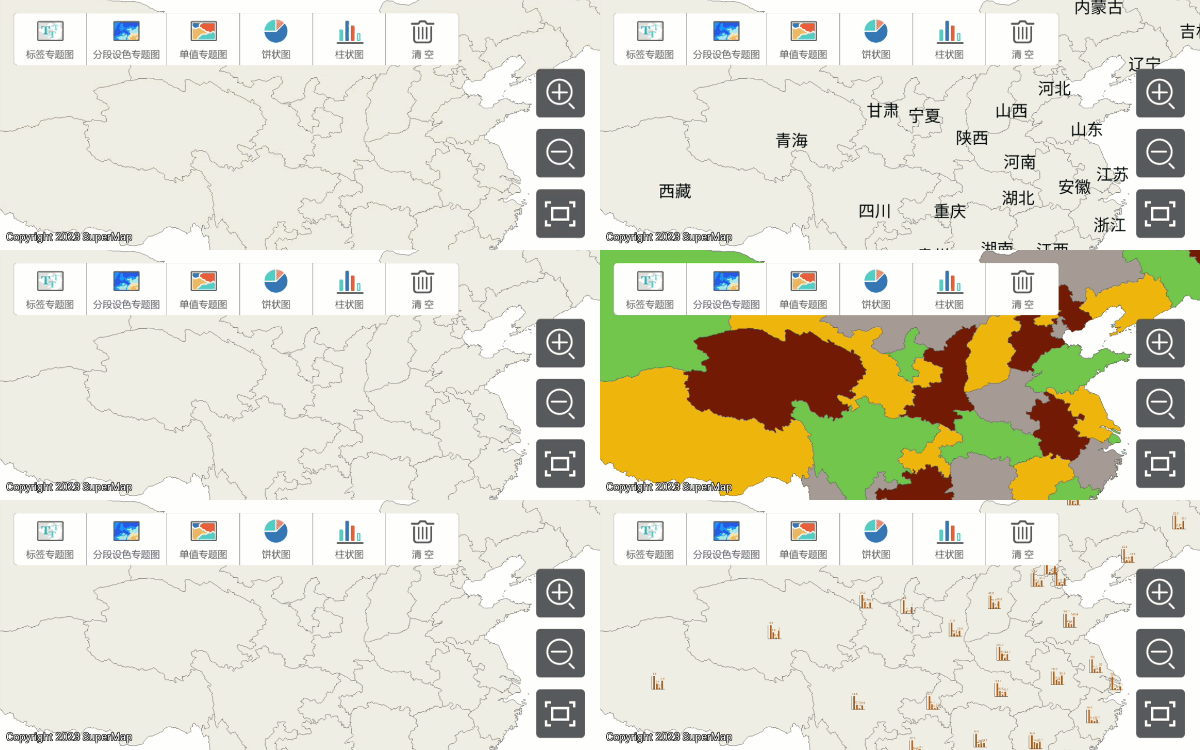
示范制作标签专题图、分段设色专题图、单值专题图以及饼状图、柱状图。
范例运行效果
 |
| 图:专题图范例运行效果 |
范例位置
Android Studio
- 产品包:产品包目录\SampleCode\SampleCode_AndroidStudio\AndroidStudioSampleCode\themedemo
- Github:https://github.com/SupermapiMobile/iMobile-SampleCode/tree/master/AndroidStudioSampleCode/themedemo
范例数据
存储位置
- 产品包:产品包目录\SampleCode\SampleCode_AndroidStudio\AndroidStudioSampleCode\themedemo\src\main\assets\ThemeDemo
- 网盘:链接:https://pan.baidu.com/s/1L-iQ3VM6s0SNS73T7fRgNQ,提取码:y3f1
部署位置:移动设备内部存储\SuperMap\Demos\ThemeDemo
许可方式
离线许可,将许可文件拷贝到"移动设备内部存储\SuperMap\License"文件夹下。
运行类库
| jar包 |
|---|
| com.supermap.data.jar、com.supermap.mapping.jar |
| so库 |
| libimb2d.so、libgnustl_shared.so、libQt5Core.so、libQt5Gui.so、libQt5Svg.so、libQt5Widgets.so(注:11.1版本开始,需添加后五个so库。) |
关键类型/成员
| 控件/类 | 方法 |
|---|---|
| ThemeLabel | setLabelExpression()、setRangeExpression()、addToHead() |
| ThemeLabelItem | setStyle()、setVisible() |
| ThemeRange | addToTail() |
| ThemeRangeItem | setEnd()、setStart()、setVisible()、setStyle() |
| DynPieChart | setChartTitle()、setAxesColor()、setShowLegend()、setShowLabels()、addPoint()、setStyle() |
| DynBarChart | setAxesColor()、setChartSize()、setShowGrid() |
使用步骤
- 点击【标签专题图】按钮,创建标签专题图;
- 点击【分段设色专题图】按钮,创建分段设色专题图;
- 点击【单值专题图】按钮,创建单值专题图;
- 点击【饼状图】按钮,创建饼状图;
- 点击【柱状图】按钮,创建柱状图;
- 点击【清空】按钮,清空专题图。


