SuperMap iMobile (hereinafter referred to as iMobile) introduces the function "Data visualization" to face big data combining GIS application features. With the feature, data can be visualized graphically, and data information can be shown effectively.
The advantages of visualizations of iMobile
Rich visualization models
Visualization models provided by iMobile include: heat maps, grid heat maps, density maps, aggregation maps, relationship maps and so on. With this models, the potential valuable information can be shown intuitively.
 |
| Figure: Visualization models (default styles) |
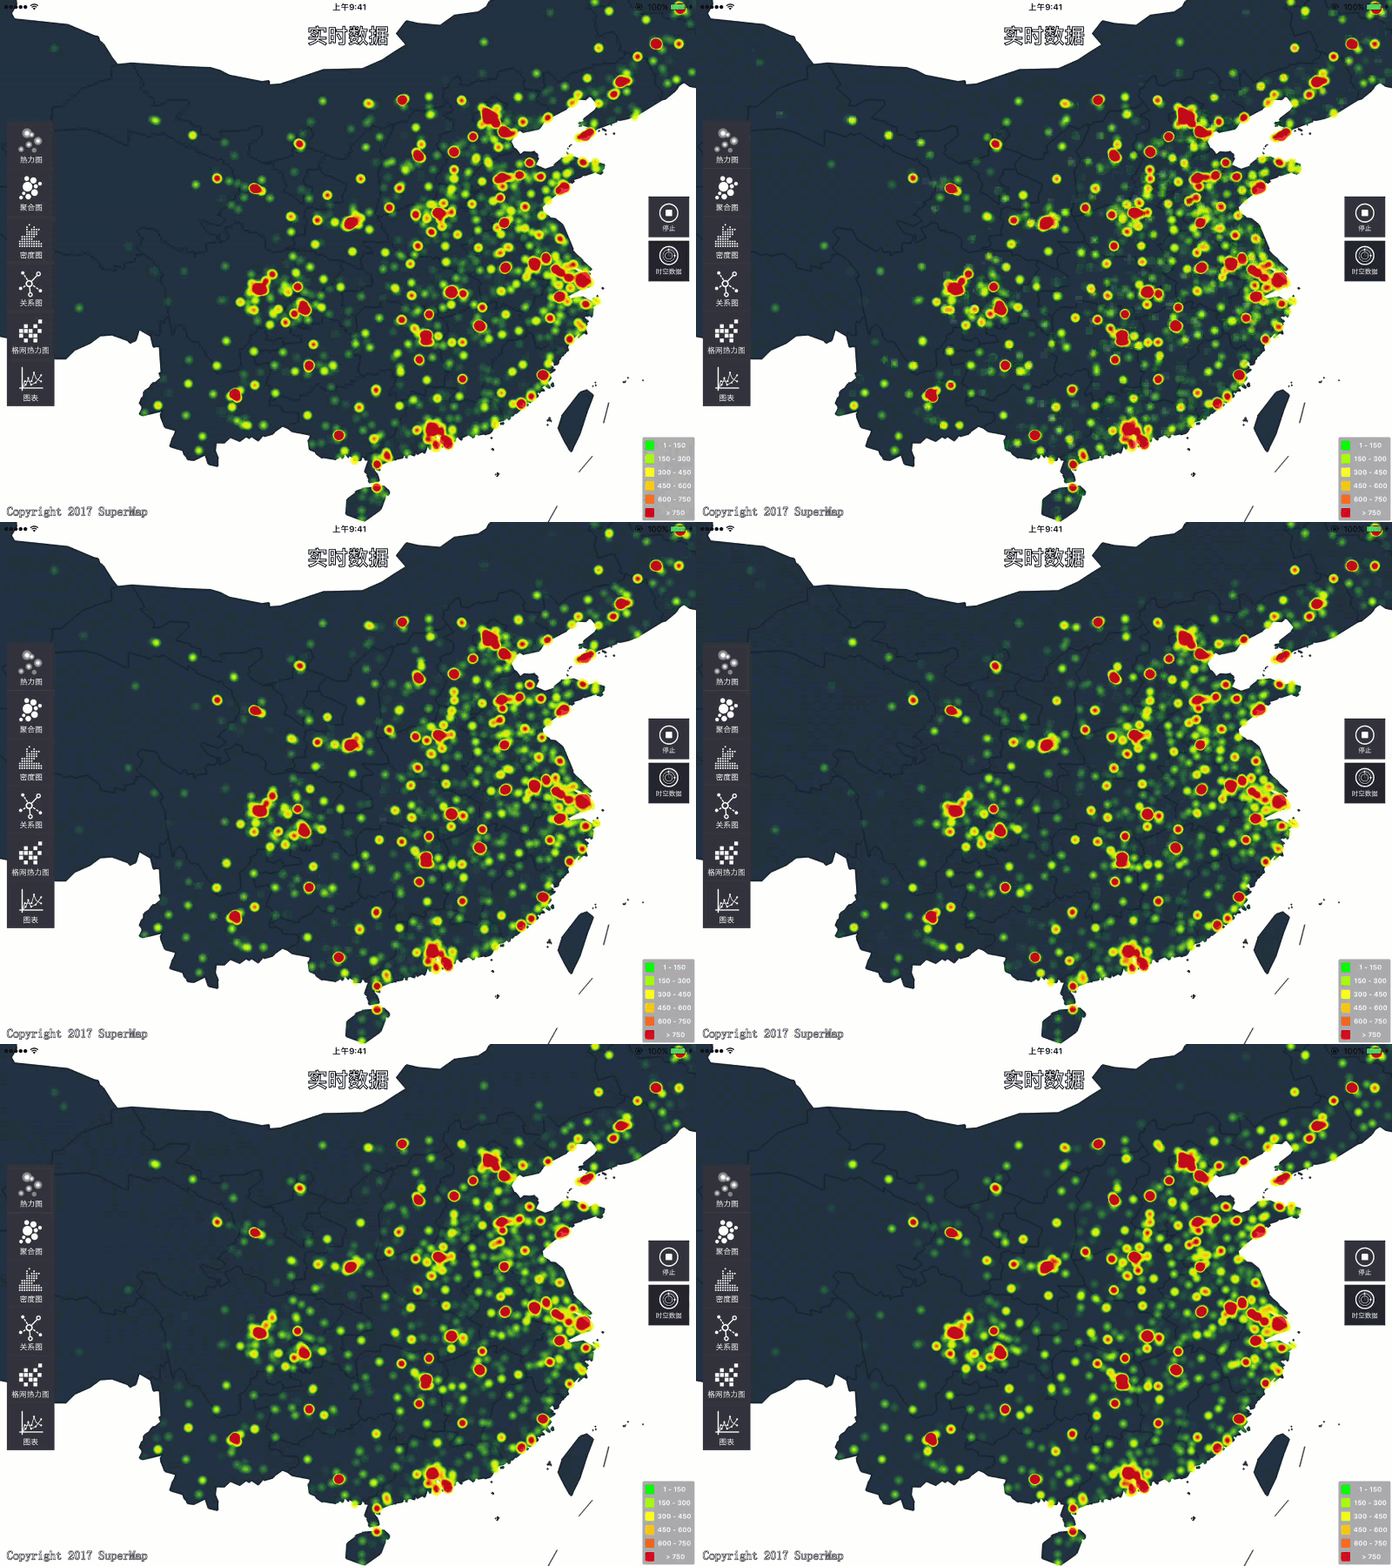
Display the data changing trend by displaying data dynamically and statically.
iMobile not only can generate practical, beautiful static diagrams, but also can make the diagram move to present the change rule over time.
 |
| Figure: Dynamic visualization |
Docking services is achieved through combining offline and online application way.
Visualizations of iMobile not only can be generated on mobiles but also can dock the distributed analysis services released by iServer. As the procedure "Generating on iServer, you can display data on iMobile" getting rid of the space limitation and taking advantage of mobile devices to master analysis results at any time.
 |
| Figure: Online visualization type |
Personalized display styles can be made by combining default styles with customized styles
A group of color schemes is provided by iMobile, and you can use them directly without any setting. Besides, rich, convenient interfaces are served for making your personalized style.
 |
| Figure: Data visualization models (customized styles) |


