Data Visualization (mchart)
Introduction
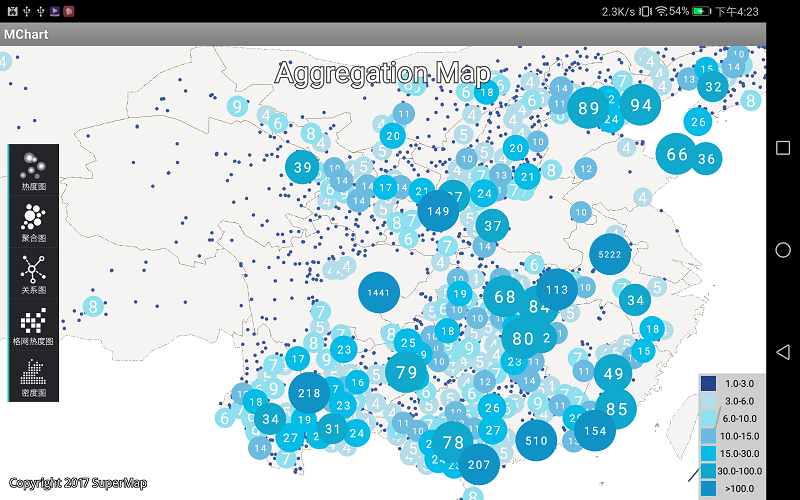
Demonstrate the production of thermographs, aggregation charts, relationship diagrams, grid thermograms, density charts, as well as histograms, pie charts, and line charts.
Operation effect
 |
| Figure: Data Visualization Operation Effect |
Location
Android Studio
- Product package: Product package\SampleCode\SampleCode_AndroidStudio\AndroidStudioSampleCode\mchart
ADT
- Product package: Product package\SampleCode\SampleCode_ADT\MChart
Data
Storage location
- Product package: Product package\SampleData\MChartData
Deployment Location: mobile device internal storage\SampleData\MChartData
License
Offline license, copy the license file to the "mobile device internal storage\SuperMap\License" folder.
Library
| jar |
|---|
| com.supermap.data.jar, com.supermap.mapping.jar, com.supermap.services.jar, chartengine.jar, com.github.mikephil.charts.jar |
| so |
| libimb2d.so, libgnustl_shared.so, libQt5Core.so, libQt5Gui.so, libQt5Svg.so, libQt5Widgets.so(Note: Starting from version 11.1, the last five so libraries need to be added.) |
Key types/members
| Control/Class | Method |
|---|---|
| HeatMap | setRadious(), setSmoothTransColor(), addChartDatas(), removeAllData(), setUpdataInterval(), insertChartDataset(), setPlayInterval(), setIsLoopPlay(), startPlay(), dispose() |
| PolymerChart | addChartDatas(), dispose() |
| GridHotChart | addChartDatas(), dispose() |
| PointDensityChart | setRadious(), addChartDatas(), dispose() |
| RelationPointChart | setIsAnimation(), setLineWidth(), setMaxRadious(), addChartRelationDatas(), dispose() |
| TimeLine | addChart(), load(), dispose() |
Basic steps
- Run the program, click on the "Heat Map" button to see the effect of the heat map; Click on the "Real Time Data" button to view the effect of accessing real-time data; Click the "Spatio-temporal data" button to see the effect of accessing spatio-temporal data;
- Click the "Aggregation Map" button to view the aggregation display effect; Click the aggregation point on the aggregation map to see the aggregation point scatter effect;
- Click the Polymer Chart button to view the polymer chart display effect, and click the point to view the chart dynamic effect;
- Click Grid Heat Map button to view grid heat map effects.
- Click Density Map to view density map effects.


