Dynamic Chart (dynamicchart)
Introduction
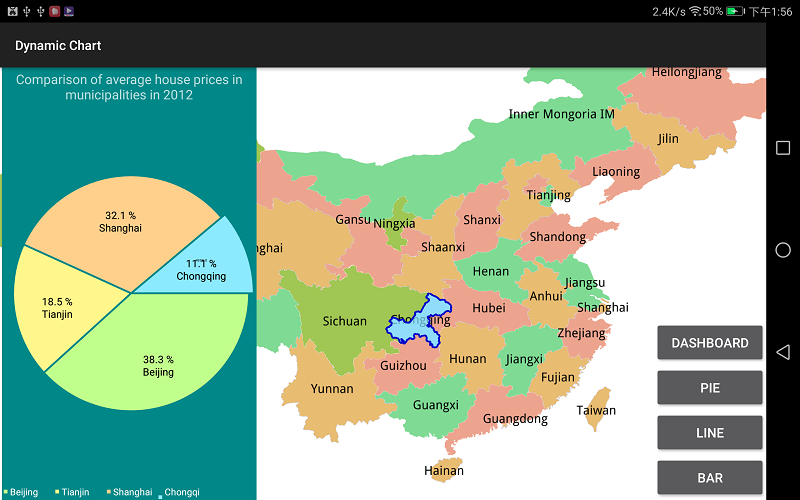
Demonstrate the production of dynamic charts such as bar charts, pie charts, line charts, dashboards, etc. to realize chart linkage.
Operation effect
 |
| Figure: Dynamic Chart Operation Effect |
Location
Android Studio
- Product package: Product package\SampleCode\SampleCode_AndroidStudio\AndroidStudioSampleCode\dynamicchart
ADT
- Product package: Product package catalogue\SampleCode\SampleCode_ADT\DynamicChart
Data
Storage location
- Product package: Product package\SampleData\DynamicChartData
Deployment Location: mobile device internal storage\SampleData\DynamicChartData
License
Offline license, copy the license file to the "mobile device internal storage\SuperMap\License" folder.
Library
| jar |
|---|
| com.supermap.data.jar, com.supermap.mapping.jar, com.github.mikephil.charts.jar, chartengine.jar, classes.jar |
| so |
| libimb2d.so, libgnustl_shared.so, libQt5Core.so, libQt5Gui.so, libQt5Svg.so, libQt5Widgets.so(Note: Starting from version 11.1, the last five so libraries need to be added.) |
Key types/members
| Control/Class | Method |
|---|---|
| Recordset | seekID(), getFieldValue() |
| PieChartData | setColor(), setGeoID(), setLabel(), setValue() |
| PieChart | addData(), setChartTitle(), reLayout() |
| lineChartData | setColor(), setGeoID(), setLabel() |
| LineChart | addData(), addXLabel(), reLayout() |
| LegendView | setColumnWidth(), setNumColumns() |
Basic steps
- Click the [PIE] button to create and display a pie chart, click the pie chart, and the map will center the corresponding area;
- Click the [LINE] button to create and display a line chart, click the line, and the map will center the corresponding area;
- Click the [BAR] button to create and display a histogram, click the column, and the map center the corresponding area;
- Click the [Dashboard] button to create and display the dashboard.


